
Step 5: Final risk level and Interpretation
In this step, the decision maker will appreciate the final value of the project risk, and give some explanations about it. For each value of the risk corresponds a suitable interpretation that will be used further in the overall risk management.
Final risk level
The system output variable conducted by the software tool gives the complex assessment of the project risk from basic factors. For the final decision making the complex assessment is taken as criteria to assess the degree of the Risk using different parameters. The higher value shows the higher degree of risk faced by the project.
The final risk level is the last appreciations of risk that will be used appreciate the project’s state or future, starting from sample risk factors through a strong fuzzy inference, that value will be used in the following decision making.
Similarly, a variety of approaches were utilized to handle project risk level. Some researchers followed the objective probability school to assess project cost risk and duration risk. They used PERT to combine the probability distributions, which reflected the variability of an activities’ duration and cost. These tools require specific and appropriate data, which is seldom available in the industrial field. Other researchers dealt with project risk as a project attribute, requiring estimates based on the scores of individual risks assessed under a hierarchical structure. While this limitation was recognized and acknowledged by researchers, it was argued that this was the only available method for aggregating subjective assessments expressed by linguistic variables. Overall project utility being used as a metaphor for the attractiveness of or the risk level of a project, derived either by a simple or by a weighted sum of individual utilities. Such an approach has the limitation of being over-simplistic due to the assumption of independency between risk factors (Dikmen et al. 2004).
Explanations
The system can also offer explanations about the results presented. This is done using a backward chain inference process that identifies ranks and presents the attributes that have high values (above 50) and that more significantly contributed to the computed level of risk. The explanations use the following generic format:
“The final risk about the assessed project is [qualifier] because:
The [attribute1] is [qualifier] (fuzzy value)
The [attribute2] is [qualifier] (fuzzy value)
…
The [attribute n] is [qualifier] (fuzzy value)”
Where the detailed explanations are sorted in decreasing order of the respective attributes fuzzy value. The final explanation about the risk value will be described according to the membership functions defined for every variable. The reasons that will be listed are just for the attributes that the risk level is at least medium.
Step 6: Advices step
This step will be one of the most important steps, because the decision maker will give convenient recommendations about the final risk level, whether to accept it or send it to the project risk control team for modifications.
Recommendation for acceptance
The advice phase is performed after the conclusion of the risk assessment, and offers recommendations about safety measures adequate to control the risk for situations where the risk level is Medium or higher.
The selection of the specific recommendations is performed using a backward chaining inference process based on the risk assessment fuzzy rules. Then the number of recommendations is exactly the number of explanations. This process identifies and ranks the key attributes that contributed to the risk assessment result (i.e., the attributes with high membership values), and provides recommendations in this order. The specific recommendations use the following format:
“Regarding the level of the final risk, the following advice is given
Recommendation 1
…
Recommendation n”
Redirection to risk control for modification
The output modification is necessary in some situations for securing a reliable decision, for instance, the circumstances of risks have been changed, the impact of some risk factors have not been adequately measured. In this case, experts and risk analysts should gather more information in relation to the risk, review the risk assessment process and modify the risk breakdown hierarchy, risk parameters or/and risk criteria to reach a reliable decision. By using the proposed risk assessment method, ill-defined or complex construction risks can be adequately assessed and risk magnitude is determined. The final result of risk assessment provides the project management team with reliable data for risk respond decision making.
Final risk level
INFERENCE
Accept
Send to Control
Final risk level
INFERENCE
Accept
Send to Control
Figure 4.7: final Risk level Decision
The output variable ACCEPTANCE will just have two triangular membership functions (accept (0, 65) or redirect (more than 65)) because the main decision will be undertaken in this very last part.
The final redirection rules will be described as follows: If the risk is greater than HIGH after the fuzzy evaluation, send to the risk control for other practices, if not, we can accept the risk but we should follow all the recommendations given by the decision system.
IMPLEMENTATION AND CASE STUDY
Implementation of the model: the software tool
In this part, we will introduce the software tool (SERAT: solar energy risk assessment tool) that we offer with the risk assessment methodology. All our objectives will be clarified, the problems that we faced will be cited and a brief introduction of the tool will be given.
Objectives
The fuzzy model for analyzing the over-all risk in the solar energy project was used to develop a fuzzy system. A Windows based application was created. The main objective of the intuitive interface is to facilitate the task of the project manager in the several mathematical steps that can be included in fuzzy logic thinking. The other objective of SERAT is to save a given assessment on a given project in a local server; such that it can be held as an experience data and reused in the upcoming projects.
System architecture and program sequence
SERAT is a local server system with offline architecture. All the calculation steps for our methodology will be implemented in the support system. For the system components contain in the SERAT, it is composed of three interrelated components, which are (1) Database, (2) model base subsystem, and (3) user interface. These three components are the basic elements in decision support system (Pearson and Shim, 1995). Figure 5.1 bellow shows the basic architecture of the SERAT.
LOCAL SERVER
USER INTERFACE
Project Information
Risk Assessment
Help
Offline support

PROJECT
MANAGER
DATA BASE
FUZZY LOGICRISKASSESSMENT
LOCAL SERVER
USER INTERFACE
Project Information
Risk Assessment
Help
Offline support
PROJECT
MANAGER
DATA BASE
FUZZY LOGICRISKASSESSMENT
Figure 5.1: SERAT system architecture
Fuzzy logic risk assessment: This part is all about the model developed and explained in chapter 4, establishing step by step the fuzzy assessment for solar energy risks, this model is translated into programming code that will realize all the computation and sequences needed.
User Interface: The design of the user interface is a key element in DSS functionality. The DSS interface should provide easy communication between the user and the system (E. Turban, 1995).Our designed interfaces will require all the project and manager information, then a risk assessment interface will be provided where the evaluator can input all the values of probabilities and severity needed for the assessment. Pull-down menus allow users to specify their needs, such the creation of a new project and the addition of an evaluator record (see Figure 5.3).
Data base: The database system is used for the storage of data and its use. It keeps the necessary information on each project. The data is generated from an external source through manual or automated processes and the results generated by the SERAT. Microsoft SQL Server was chosen as the data access mechanism due to its high speed, ease of use, and low memory overheads. The current implementation makes use of Microsoft Access.
Challenges and coding environment
The first challenge was programming with a new language in a new environment. We had to study VISUAL BASIC from the ground up and gain at least an intermediate knowledge before implementing the system. We had faced some challenges in the programming of the Windows Application, but the most persistent was the uncertainty mechanism, where the value continued to be equal to zero at all times.
The second issue we found was to make the connection between the user interface that we have created and the local data base, to give the possibility to the risk assessor to save his work and reuse it.
For the coding, we chose the Microsoft Visual Studio 2015 that allows using thousands of libraries and real time debugging and testing of the different interfaces that we have designed for this project.
Installing
The first and most important step using SERAT is the installation, because we can’t evaluate our system nor test it without first being able to install it on computers. The program installation can be: Automatically using the auto-run feature, it will install directly on the computer or manually: The user accesses the file through the file and double clicks setup icon.
In both cases the program will install only on Windows OS on the C drive under “serat” Directory Folder. This will launch the installation process, and you will see the next screen as in figure 5.2.
Figure 5.2: Application Installation
After this step, the application will install successfully on your hard drive, under “serat” Folder. This completes the installation process and the evaluation can start.
Presentation of the interfaces
Home welcoming interface
The home interface component can be lunched from the server to the client desktop. Pull-down menus allow users to specify their needs, such the creation of a new project and the addition of an evaluator registry, saving or printing a project.
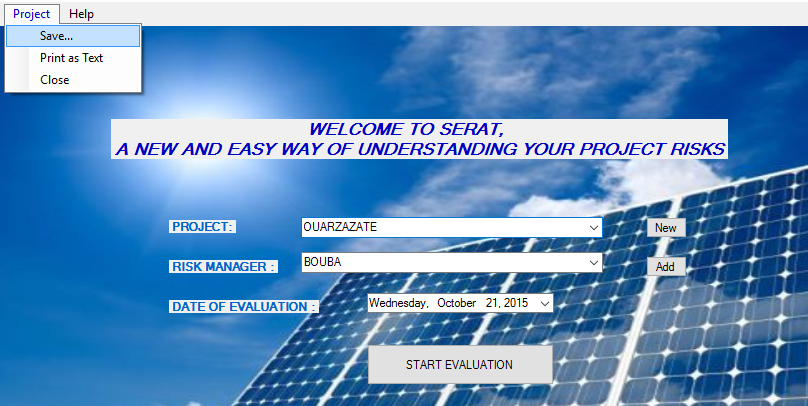
Figure 5.3: The home welcoming interface
From this Home interface, the user can have access to a Help window, from which he will be given all information about copy or reproduction in any form about this application, some information about the use of SERAT (how to compute the final risk level) unit by unit and finally all information about the author if any question is to be asked.
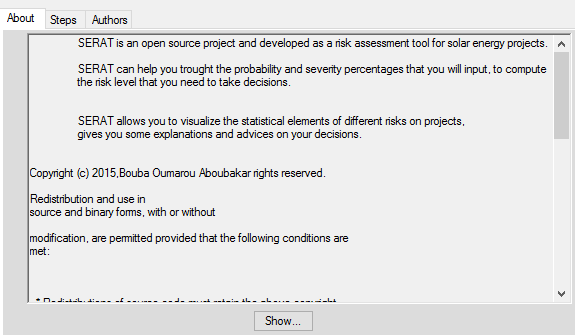
Figure 5.4: Information about the SERAT
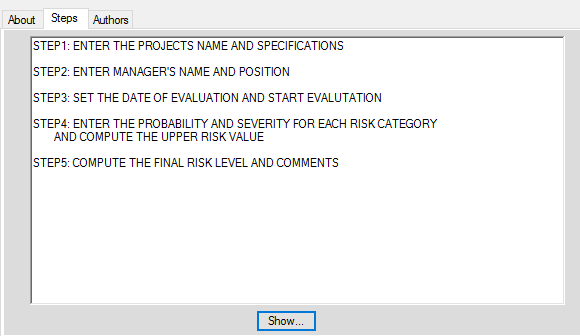
Figure 5.5: steps of computing the final risk level
From this two interfaces, the user just need to press show and the needed information will be available.
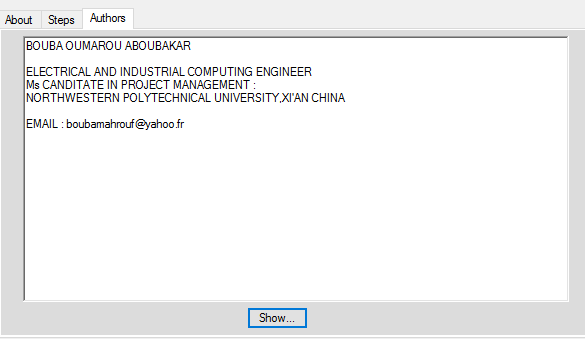
Figure 5.6: Authors information
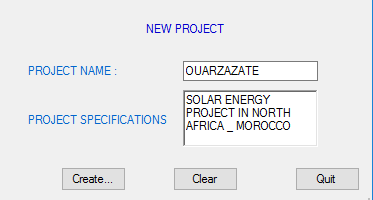
Figure 5.7: Starting a new project evaluation
After providing project’s information, and before starting the effective evaluation, the project manager should enter his information that will be kept in the data base such that the next time he can easily reuse all needed information, see Figure 5.8.
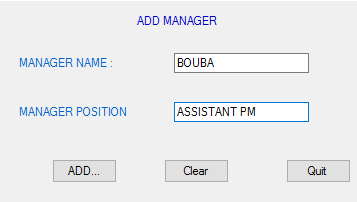
Figure 5.8: Project manager’s basic information
Evaluation interface
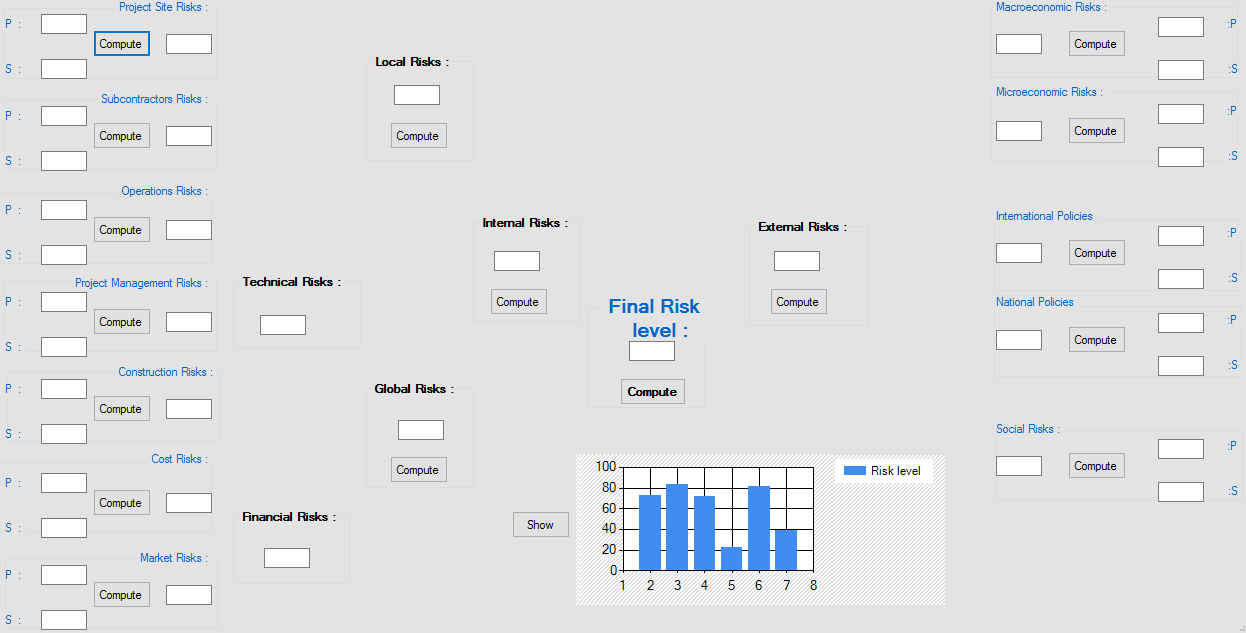
Figure 5.9: Project evaluation interface
Once the system is set, the testing and evaluation of the root can be effectively done. The tool will run according to the user input. He will have access to this evaluation interface where he needs to input step by step all the values of likelihood and consequence of each risk category and compute the n+1 level risk, starting from the left to the right side of the interface. Finally he can compute the final risk level of the project, all based on fuzzy estimation. After having computed the final risk level, The user has an opportunity to represent a histogram of all the height major risk categories, It will lead to an output where the user will be aware of the percentage of each risk level if the user chooses any given risk category. This diagram will help him printing the report that will be really useful for the decision making.
Case study: OUARZAZATE SOLAR COMPLEX PROJECT
This section includes an example of applying the designed model on a real solar energy project in Morocco, financed by the African Development bank. Procedural steps of the risk assessment module have been highlighted below. For the calculation steps of the evaluation (steps 3, 4, 5), we have decided to realize it in two ways: a laborious way using MATLAB SIMULINK, and a judicious way, using our software tool (SERAT).
Project description
The project is an autonomous investment operation executed under an electricity production PPP that will be supported by the Bank, CTF and other donors (AFD, EIB, World Bank, KFW and EU/NIF). The financing instruments proposed comprise an AfDB loan and a CTF-AfDB loan to be awarded to MASEN and guaranteed by the State of Morocco. MASEN is a State-owned limited liability company established in March 2010 to manage the Moroccan Solar Program (NOOR Program).
The project seeks to boost Morocco’s economic and social development, by using eco-friendly approaches to build national capacity to generate electricity from clean sources. It focuses on constructing two concentrated solar thermal power stations with a total capacity of approximately 350 MW and a cumulative average output of over 1,100 GWh/year
| N0
A |
Name of component | Cost(in EUR million) | Description of components | ||
| Energy infrastructure | 1009 | 743.04 | 1752.04 | N00Ro II parabolic trough power plant whit a capacity of approximately 200MW a five hours thermal storage mechanism and an output of 600GWH/year
N00Ro III tower power plant with a capacity of approximately 150MW a five-hour thermal storage mechanism and an output of 500 GWH/ year Works control and supervision. |
|
| Total | 1009 | 743.04 | 1752.04 |
Table 5.1: Project Components
Given the level of mastery of the two variants of concentrated solar thermal power plants currently developed worldwide (parabolic trough variant and solar tower variant), MASEN opted to build the NOORo III power plant using solar tower technology to supplement the NOORo I and NOORo II power plants which will use parabolic trough technology.
The total project cost net of taxes and customs duties is estimated at EUR 1,752.04 million, comprising EUR 1,138.83 million in foreign exchange (65%) and EUR 613.21 million in local currency (35%). Its distribution per power plant is EUR 1,009 million for NOORo II and EUR 743.04 million for NOORo III. This cost includes an overall provision of about 9% (of which 4.5% for operational contingencies and 4.5% for price escalation).
| Financing sources | F.E | Local currency | Total | total |
| AFDB loan | 65.00 | 35.00 | 100.00 | 5% |
| ADB-CTF | 55.85 | 30.07 | 85.92 | 5% |
| Bank group sub-total | 120.85 | 65.07 | 185.92 | 10% |
| AFD | 32.50 | 17.50 | 50.00 | 3% |
| EIB | 227.50 | 122.50 | 350.00 | 18% |
| World Bank-loan5 | 46.93 | 169.67 | 216.60 | 11% |
| World bank-CTF | 55.85 | 30.07 | 85.92 | 35% |
| KFW | 425.10 | 228.90 | 654.00 | 35% |
| EU-NIF6 | 58.50 | 31.50 | 90.00 | 5% |
| Masen and private developers | 171.60 | 92.40 | 264.00 | 14% |
| Sud-total for other co-financiers | 1017.98 | 692.54 | 1710.52 | 90% |
| Total financing | 1138.82 | 757.62 | 1896.44 | 100% |
| Comprising project cost (energy infractructure:N00Ro II and N00Ro III. | 1138.82 | 613.22 | 1752.04 | 65% |
| total | 144.40 | 144.40 |
Table 5.2: Project financing sources (in Million EUR)
The project will be implemented on the Ouarzazate solar complex (3000 ha) whose land, selected on the TamzaghtenIzerki site belongs to the Ait Ougrour Tondout ethnic community (Ghessate rural council area). This site is situated 10 km from Ouarzazate town along National Highway No. 10 which leads to Errachidia. The project beneficiaries will be the Moroccan population, Moroccan businesses and all productive sectors.
STEP 1: Establish a risk assessment group
Six experts with high qualification in solar energy projects and power plant projects are selected to form the risk assessment group. The risk evaluation team is formed by a civil engineer, an electrical engineer, a business development director, a solar software developer, an actuarial and solar analyst and a project manager, all of them experts in rehabilitation of buildings. The team undertakes the risk assessment by using the proposed approach.
STEP 2: Preliminary Step
In this step, the decision makers will prepare all relative work which will help to compute the exact value of the risk and try to manage it in a much convenient way.
Problem Analysis
The state commitment to ensure the financial balance of the Moroccan Solar Program, which includes the current project, is crucial to the financial viability of the operation. This commitment which took concrete form in 2010 with the signature of an agreement between the State, MASEN and ONEE led to the launching of works on the power plant. Under that agreement, the State undertook to finance the gap between the kWh cost price paid by MASEN to the project companies and the selling price which MASEN charges to ONEE. A special agreement on State financing of the gap to be generated by power plant was signed on 13 July 2012 between the State and MASEN (the concessioner).The main problem of the risk assessment is then to make sure the right value of the risk is computed and effective measures are undertaken to reduce these risks to a minimum value, such that the agreements will be satisfied.
Task allocation
According to the algorithm chosen in chapter 4 for task allocation, every expert in the risk assessment group had been dedicated a specific concern according to his/her area of specialty. The duration of any task, the responsibility and completion is also dedicated by every expert to the team members.
Use of experience data
The use of experience data on previous projects realized by the bank in Africa, the previous research on the risk management field made for this research and previous reports on solar energy risks have been a great help in the understanding of the steps to follow in this work. Several actions can be deployed to use the data, divided amongst the two approaches RA and the subsequent RM are tailored to fit the project parameters. When conducting the actual identification the selection of the actions is based on the phase in which the project resides, the involved staff, the accessible documentation, project complexity and size, available resources and desired results with quality at a stated level.
Risk identification
In a structured brainstorming session, (using the designed RBS), Hazards have been identified and assessed by the experts in a number of ways:
• Using checklists;
• By referring to codes and standards;
• By undertaking more structured review techniques;
• Previous experience in the area, including that of third parties;
• General observation and HSE awareness;
• Audits;
• Accident / incident investigations;
• Drills and exercises; and
• EHS/Environmental meetings.
It must be noted that all hazards are to be reported, including those eliminated any situation where an Equipment Incident could cause injury or other significant loss under different circumstances will first be reported as a Near Miss. The 31 risk factors or hazards identified are listed below.
| Variable | Identified risks | explanations | Affects |
| R1 | Changes on startup | Legislative changes in the obtaining of the plant Startup | Schedule |
| R2 | Bureaucracy | Rigid Bureaucracy and paper work in the country | Schedule |
| R3 | Lack of conformity with international Normalizations | IEC 62446 ,IEC 60364-1,IEC 62548 , IEC 61829 | conformity |
| R4 | Changes on electricity prices | whether there is any risk that the prices vary during the plant construction | Revenue |
| R5 | Changes on VAT | Increase of VAT of more than 2% in the construction period | TAX |
| R6 | Natural Environmental Risks | Natural disasters | Security |
| R7 | land acquisition consequence | Assessment of the risk of social disapproval, which may impede project execution. | conformity |
| R8 | Procurement risks | Inadequate procurement planning | Schedule |
| R9 | Impact of Technological Progress | Difficulties on following technological changes during the project | Schedule |
| R10 | Accident-related loss | Mishaps or failures during the construction and operation phases | Security |
| R11 | Reliability Risk | What are the component failure/reliability risks | Revenue |
| R12 | Productivity rate of the panel manufacturer | What is the production availability | Revenue |
| R13 | Unplanned maintenance | Going on maintenance work without any accurate plan | Schedule |
| R14 | Performance risk | concessioner may not be able to efficiently monitor power plant construction activities given the high number of power plants it has to supervise | Schedule |
| R15 | Organizational Structure | Lack of conformity in the organization of the project team | Schedule |
| R16 | Evaluation of Project | Misevaluation of the project variables | Revenue |
| R17 | Accuracy of Market Forecast | Deviations between the calculated and the actual value of the market | Revenue |
| R18 | Market Operational Capabilities | Up to which price the market is ready to buy the KWh | Revenue |
| R19 | Expecting Project Profitability | Mistake in the project profitability calculation | Revenue |
| R20 | Environmental constraints/prohibitions | What is known and what might not be known about the site? | Conformity |
| R21 | Infrastructure constraints | water, geotechnical, and infrastructure conditions | Conformity |
| R22 | Commitment honor risk | the possibility that private developers may not be able to honor their commitments during construction and operation | Revenue |
| R23 | solar radiation risk | extreme weather conditions | Revenue |
| R24 | Insurance risk | Changes in insurance costs could make project uneconomic | Revenue |
| R25 | Cost estimation risk | Misjudged cost estimation | Revenue |
| R26 | Off-Taker Risk | Difficulties that the concessioner could encounter in financing the gap between the kWh purchase price paid to project companies and the selling price | Revenue |
| R27 | delays in legal agreements | Possible Delays in signatures and paper work | Schedule |
| R28 | delays in constructions and operations of the power plant | Possible delays due to any mistake or failure on project | Schedule |
| R29 | Late payment | Late payment of the loan by the client | Schedule |
| R30 | Reference by subcontractors | Lack of reference to all the subcontractors about project financial situation | Revenue |
| R31 | Relation with the third party | Weak relation between the client and the Bank | Schedule |
Table 5.3: Identified sources of hazards for the selected project.
Risk classification
As a result of the study that we made previously on this part, the risk classification is then just to choose and classify the identified hazards into the different risk categories and subcategories that we found out using the survey. The risk classification framework as shown in the following table helps in the formulation of ways of accessing risks to solar energy projects.
| Risk subsection | Identified risk factors variables | Frequency of risk subsection |
| international policies | R3 | 1 |
| National policies | R1,R2 | 2 |
| microeconomics factors | R5 | 1 |
| macroeconomics factors | R4 | 1 |
| social risks | R6,R7 | 2 |
| Project site risks | R20,R21 | 2 |
| subcontractors risks | R22 | 1 |
| maintenance /operation risks | R11,R12,R13 | 3 |
| PM risks | R14,R15,R16 | 3 |
| construction risks | R8,R9,R10 | 3 |
| cost risks | R23,R24,R25,R26 | 4 |
| market risks | R17,R18,R19 | 3 |
| client risks | R29,R30,R31 | 3 |
| time delay risks | R27,R28 | 2 |
Table 5.4: Risk classification
Construction of a risk breakdown structure
Using the list of classified risks, by conformity to the model developed in chapter 4, the following risk breakdown structure has been developed.
Figure 5.10: risk breakdown structure
On the basis of a view of the work environment, the risk assessment group constructs a hierarchy as shown in figure above, which consists of all sections described in chapter 4. Each section has number of major risk factors. For example, under the social risks section, there are two major risk factors named land acquisition consequence and natural environment risks.
THE MATLAB TOOLS FOR THE STEPS 3, 4, 5
The model consists of .fis files, and an .m file. The .m file is shown later in this sub-chapter, and all the files are added to this thesis.
Fuzzy logic toolbox
The model has been created using the Fuzzy Logic Toolbox, which is part of the MATLAB 2012 suite .The first editor available in this toolbox is called the Fuzzy inference editor (FIS). FIS displays general information about a fuzzy inference system and allows users to define basic characteristics of the model (the number of input and output variables etc.). In addition, this toolbox enables users to set the way of defuzzification, aggregation etc. Figure below demonstrates that the “riskfactorevaluation” branch of the model has two inputs and one output.
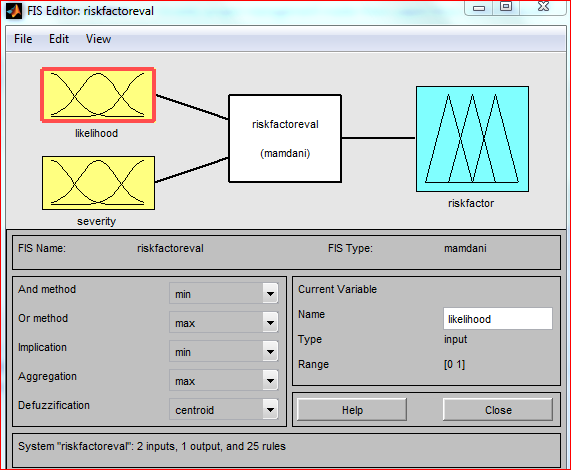
Figure 5.11: Fuzzy inference editor
Membership function editor
Membership Functions Editor (MFE) is part of the Fuzzy Logic Toolbox. It can be run directly from the FIS editor. MFE enables users to set characteristics for the inputs and outputs. The number of functions for each output and input is set, and each function has settings such as range, curve type, name, and parameters. To demonstrate, the functions for “severity” are shown below.
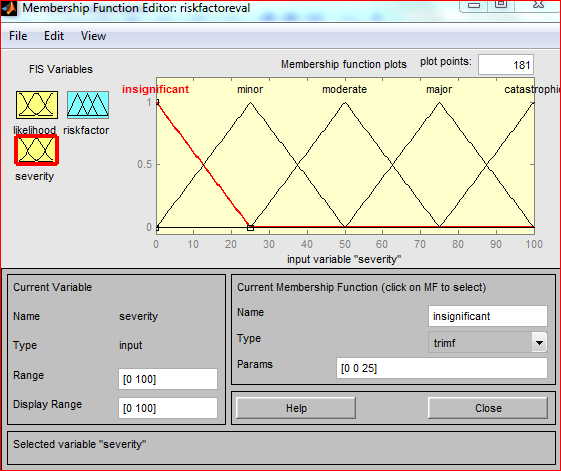
Figure 5.12: MFE overview: severity variable
Rules editor
As the name implies, this editor allows users to create fuzzy rules, which govern the whole model. The rules are created by combining individual criterions with AND and OR operands. A weight can be assigned to each and every rule. The weight is 1 by default. The figure below shows a screen of Rule Editor, the aforementioned rule is number 1 on the list of rules.
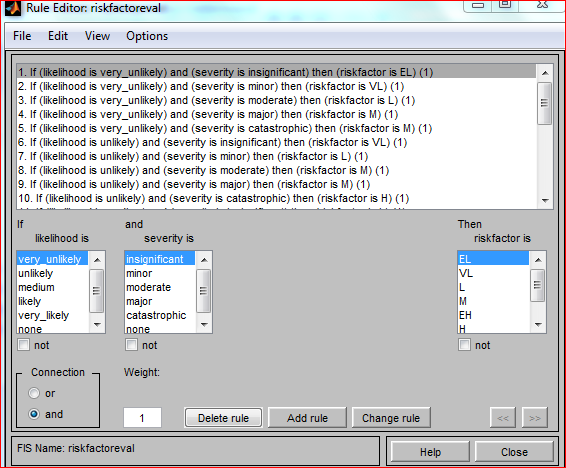
Figure 5.13: Rule editor
Rule viewer
The Rule Viewer provides easy-to-understand overview of all rules within the model. It contains all rules and all input and output variables. Additionally, this editor is a great tool for debugging and optimization. The vertical red lines indicate the values of the input variables. They may be dragged as needed or it is possible to change the input values by simply typing the values in the box below the list of rules.
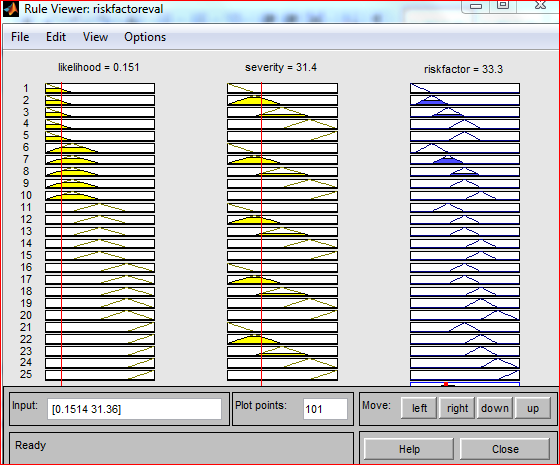
Figure 5.14: Rule Viewer
Surface viewer
Surface Viewer is capable of displaying the final function of two variables in 3D. The two variables (X and Y) can be chosen from the menu. Consequently, it is possible to select any combination of input variables.
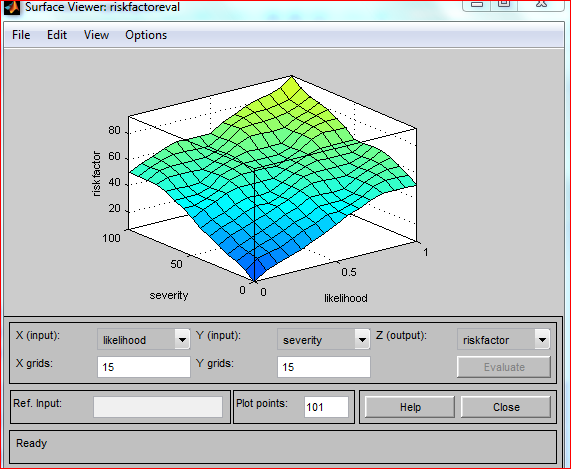
Figure 5.15: Surface Viewer
Step 3: Risk level measurement
In this step, according to the model developed, the Matlab simulink suite is used to measure the risks, factor by factor.
Measure the risk factors function level
Given the probability and severity of each risk factor as shown in the risk register provided in the table below, the decision maker will find the risk factor level. In the table, the risks that are identified are clearly classified level by level and category by category. For each risk factor, after a brief discussion and a vote among the project team members, numerical values are allocated to prepare the fuzzy study.
| Level 0 | Level 1 | Level 2 | Level 3 | Level 4 | Level 5
(risk factors) |
Probability
(%) |
Severity
(%) |
Risk Phase |
| FINAL
RISK LEVEL |
Internal risks | local risks | Project site risks | R20 | 5 | 10 | mature | |
| R21 | 30 | 7 | mature | |||||
| subcontractors risks | R22 | 85 | 50 | close | ||||
| global risks | Technical risks | maintenance /operation risks | R11 | 3 | 30 | mature | ||
| R12 | 10 | 10 | mature | |||||
| R13 | 50 | 15 | mature | |||||
| PM risks | R14 | 90 | 15 | mature | ||||
| R15 | 10 | 5 | mature | |||||
| R16 | 8 | 10 | mature | |||||
| construction risks | R8 | 55 | 15 | mature | ||||
| R9 | 20 | 5 | mature | |||||
| R10 | 1 | 3 | mature | |||||
| financial risks | cost risks | R23 | 30 | 3 | plan | |||
| R24 | 50 | 2 | plan | |||||
| R25 | 5 | 15 | plan | |||||
| R26 | 80 | 30 | plan | |||||
| market risks | R17 | 25 | 20 | plan | ||||
| R18 | 20 | 15 | close | |||||
| R19 | 2 | 25 | close | |||||
| client risks | R29 | 75 | 2 | close | ||||
| R30 | 80 | 2 | plan | |||||
| R31 | 20 | 7 | plan | |||||
| time delay risks | R27 | 20 | 2 | mature | ||||
| R28 | 70 | 5 | mature | |||||
| External risks | economic risks | microeconomics factors | R5 | 90 | 2 | plan | ||
| macroeconomics factors | R4 | 10 | 15 | plan | ||||
| policy risks | international policies | R3 | 5 | 10 | plan | |||
| national
policies |
R1 | 50 | 2 | plan | ||||
| R2 | 80 | 5 | plan | |||||
| social risks | R6 | 1 | 50 | mature | ||||
| R7 | 3 | 2 | mature |
Table 5.5: Risk register
According to the model developed, every value of probability and severity will be input by the decision maker into a fuzzy logic model. For this step, as designed for the research, seven triangular membership functions are allocated both for the probability and the severity taking values(in percentage).The Fuzzification and inference process are respectively “MIN MAX” and mandani methods as provided by the Matlab library. The result for a single risk factor calculation is given in the figure below.
For example, if it is given to us to calculate the risk factor level for the risk R20.Its probability is 5% and its severity is 10%.
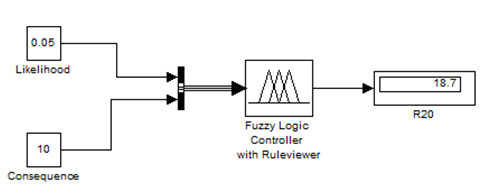
Figure 5.16: risk factor level calculation for R20
As we can see from the figure 5.16, the assessed risk factor level for R20: environment constraints and prohibition is 18.7%.As the assessment will continue, this value will be used for further evaluation.
For the calculation of the risk factor, we used five membership functions to describe the value of the likelihood or the severity. The input parameters are represented on the unit universe [0,1] for probability and [0,100] for severity with triangular membership functions describing the linguistic variables .
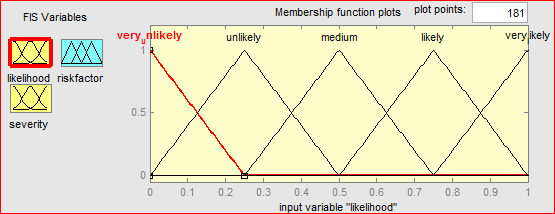
Figure 5.17: Membership functions for the variable “likelihood”
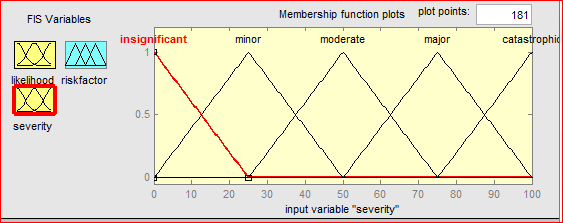
Figure 5.18: Membership functions for the variable “severity”
For the output variable which is the risk factor, we designed seven membership functions to make sure that the result will cover all the possibilities that will come from the input variables.
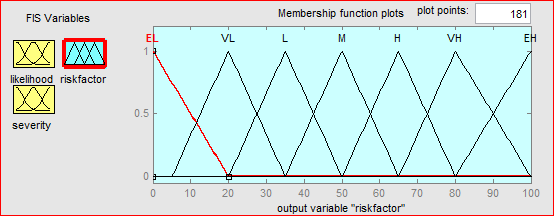
Figure 5.19: Membership functions for the output “risk factor”
For the design of the fuzzy controller, all the membership functions are triangular according to our model. According to the logic table described in chapter 4, for two inputs and a single output here are some rules that the controller will follow.
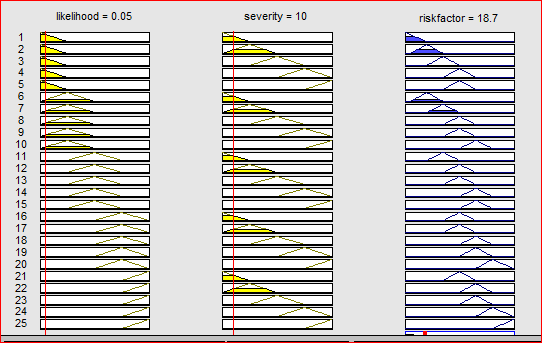
Figure 5.20: Rules viewer for the risk function evaluation
As we have five membership functions for each, the maximum rules that we can construct is 25, by this way, every logic situation in the input can be transferred to the risk factor level.
Risk ranking
After every risk factor level is computed for the 31 identified risks, it will be interesting in the decision to make, to know which of the risk subcategories is dominant among the ones identified previously. For that, a design of the risk subsection histogram would be the best method to help the project team to analyze easily the most sensitive points of the overall analysis.
Figure 5.21: risk subsection histogram
For the Ouarzazate project, we can clearly see that the most sensitive risk subcategories are mostly cost and market risks, or management and technical risk. While taking a decision, the project manager should have a good care of these points.
Evaluate low effect risks
Low effect risk (the ones considered as not risky at all) had been ignored by the project team, to simplify the calculations, and reduce the complexity of the model, so no evaluation will be conducted for these risk in this thesis.
Step4: Fuzzy Inference Step
In this step, all the mathematical computations will be done; the Matlab suite will operate all the calculations needed to make his task easier. What the project manager did in this step was just to follow the opinions given by the project team (experts).
Experts Opinion
The six experts that have been selected to operate the risk management have given the following advices.
Use the maximum number of membership functions to cover all the values of the risk factors that have been calculated.
Take a good attention on the financial risks that appeared to be the most sensitive part.
For the inference rules just draw a logic table and follow all the process of identifying rules.
Determine the membership functions
As mentioned in chapter 4, according to previous research and expert advices, all the membership functions that will be used in the decision making are triangular. For the risk levels in intermediate level of the hierarchy, the input parameters are represented on the unit universe [0,100] with seven triangular membership functions describing the linguistic variables.
The experts have agreed that seven levels of linguistic terms to describe the variables as extremely low (EL), very low (VL), Low (L), medium (M), high (H), very high (VH) and extremely high (EL).The definitions of the membership functions for a Fuzzy logic controller with two entries is given by the figure bellow.
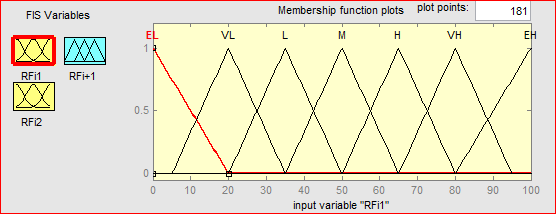
Figure 5.22: membership functions for a fuzzy bloc with two entries
For the output variable, the membership functions have the same distribution as the input variable but the last triangular function goes up to100, to give a wide range for the “very high” and reduce all the uncertainties.

Figure 5.23: The seven membership functions for a given risk level output
Determine the Inference rules
The inference rules defined for each fuzzy component is exactly as advised by the experts. All possibilities of the logic truth table linking the inputs and output are listed in the rule editor. So the number of the rules depends on the number of inputs of the controller.
For example, for two inputs and a single output from a given level i to a higher level i+1, used seven membership triangular functions, the rules will be given as follow.
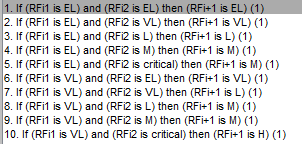
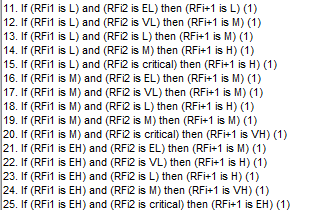
Figure 5.24: Fuzzy rules for a risk bloc of two inputs
The logic truth table gives us a result of 25 rules (five membership functions for each input).For the fuzzy components using three and for inputs, the screenshot of the rule editor will be given in Annex.
Input the calculated value
The input of every calculated value of risk from a given level I to a higher level i+1 is done automatically by the SIMULINK suite. A simple link is mentioned to show the linkage between all the parts of the simulation.
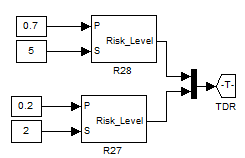
Figure 5.25: Input of the time delay risks into the next step
In this example shown in figure5.25, the TDR is a label allowed by the Matlab suite that will take directly the value calculated from the previous levels of the hierarchy, and transfer it to the next level. The figure below shows how the TDR is reused for computing the global risks and internal risks respectively.
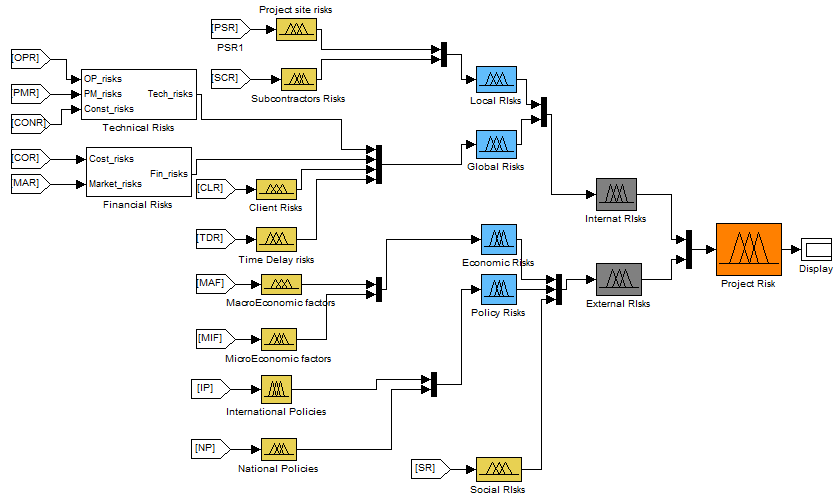
Figure 5.26: Reception of the calculated values in the next levels
Fuzzification Interface
This step is also done in background by the Matlab suite, for every entry in a given fuzzy component, the input is always a crisp numerical value limited to the universe of discourse of the input variable and the output is a fuzzy degree of membership in the qualifying linguistic set Fuzzification of the input amounts to either a table lookup or a function evaluation.
Fuzzy inference: the fuzzy inference method used by the Matlab suite is mandani method this “min max aggregation”. So for all the fuzzy components calculating risks, this method is definitely used.
Defuzzification Interface: As we explained in chapter 4, Matlab toolbox uses the centroid method explained by the equation for defuzzification and find out the actual value of the risks for every fuzzy component.
Step 5: Final risk level and Interpretation
This step is about the calculation of the final risk level for all the project, and explanations needed for the project manager to take a decision.
Final risk level
In reviewing the assessment process, the final result is found by assessing step by step every level of risk so that the final value will be given to the decision maker. This result provides the risk management project team with valuable information for risk control or response decision making. The figure bellow shows the calculation of the final value of the risk, using SIMULINK.
Figure 5.27: Final risk level
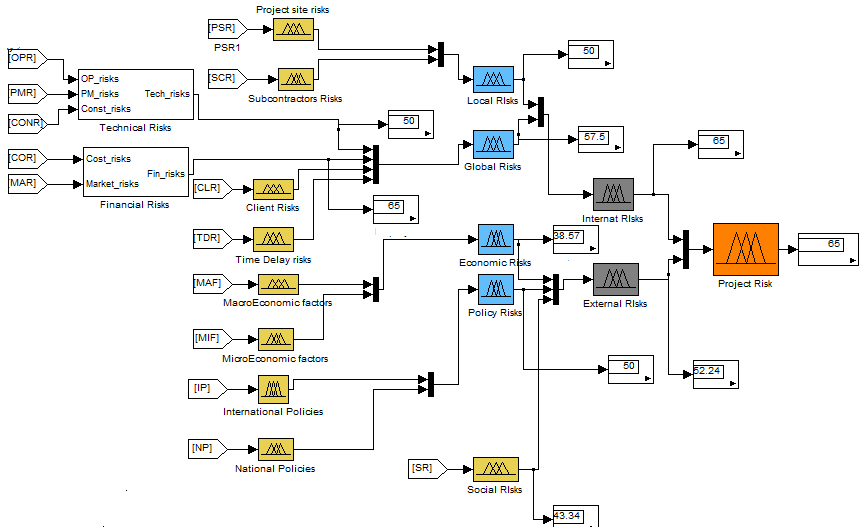
We evaluate the effectiveness of this final risk level calculation using a fuzzy analysis method in back; we can clearly see the result we got in percentage for the Ouarzazate solar project is 65(High level risk).
The system output variable gives the complex assessment of the final project risk from identified hazards relevant to the Ouarzazate solar plant. For the final decision making the complex assessment is taken as criteria to evaluate the level of the project Risk using the parameters proposed in the design of the model. The overall risk calculation is available in annex.
Explanations
To emphasize the importance of understanding the level of risk, we have transferred the given value into a simple MATLAB function that has the role to translate the different scenarios into an explanation. . Using the generic format explained in chapter 4, we can have these results.
“The final risk about the assessed project is [Medium] because:
The [Internal risk level] is [High] (65)
The [Internal risk level] is [Medium] (57.5)
The [Technical risk level] is [Medium] (50)
The [Financial risk level] is [High] (65)”
These data demonstrate that project management team must be paid special attention to the composition of the financial risks and with all the activities and hazards going through. The technical risks have also to be considered because at this level, although the 50% risk level is Medium but it might generate more added values on the upper levels.
Step 6: Advices step
This step, as described in the previous chapter, includes the acceptance evaluation of the project risk and the advices to take while undertaking the project.
Acceptance
The value of the final risk of the Ouarzazate project will then be taken and put into a new fuzzy assessment to define whether to accept or not this risk. Figure bellow shows the acceptance assessment and its interpretation. The acceptance rules and membership functions are shown in annex.
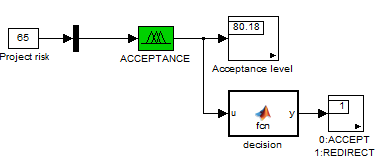
Figure 5.28: Acceptance scheme
We can clearly see that the final value of the project risk is at the limit of acceptance, but the project team should redirect this value to the project control team, and they can follow and review the given risk categories.
Advices
According to the model developed in chapter 5, the recommendations that should be followed by the project team for the Ouarzazate power plant project can be written as follow.
“Regarding the level of the final risk, the following advices are given:
Please send the critical factor of financial risks to control
Please review and make a clear strategy about the technical factors”
As we have seen clearly, the two most critical parts in the Ouarzazate project are the technical incentives and financial directions, before the startup of the company; the project team should review all the factors that are included in this two risk categories. In particular, suitable planning, supervision and quality assurance activities are critical at all stages of the PV plant in order to minimize the risk of damages and outages, optimize the use of warranties, avoid dilution of resources and ultimately optimize the overall performance of the PV plant should be performed.
Serat evaluation of steps 3, 4, 5
Our evaluation of the Serat system has been resumed on this evaluation interface, from which the project manager (user) can escape all the calculation methods and find out the final risk level, which can be used to make the final decision on the project’s vulnerability.
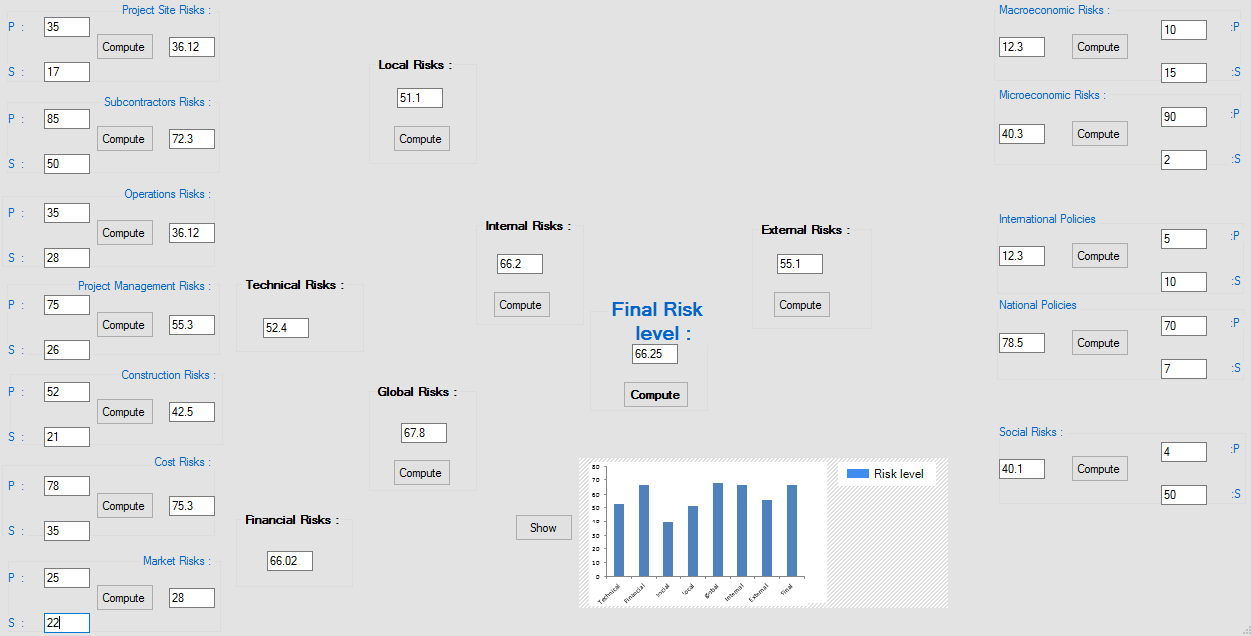
Figure 5.29: Application of the method using SERAT
This risk analysis application allows users to launch risk assessments from different places within the system. Users can use the provided textboxes to launch risk assessment input vales such as probability and severity.
In this case of OUARZAZATE solar energy project, we can clearly see that the results found by our application are different from the once found by matlab Simulink. For example, the final risk level appeared to be 66.25 for this application but while being 65 using the matlab Simulink model, there are two main reasons for this matter:1.The operator error might be a huge importance in calculating the fuzzy values of the risks, because while using the Simulink model, the project manager had to input all the values of probability and severity at the risk factors level, for SERAT, the values are interred in the risk cathegories.2.The Simulink induced error due to faulty calibration, and the settling period of matlab which was designed using a C++ interface.
After computing the final risk level, the project manager has the opportunity to create an interactive report in a chart, all the main risks on his evaluation form, which will lead him directly to the right decision upon the risk control. After categorizing and computing risks levels, the project team decides the controls that could mitigate the risk. The decision for what regulations are needed lies with the project manager. The team’s conclusions as to what risks exist and what controls needed are provided along with a related action craft for control implementation.