
CURRENT APPROACHES FOR DECISION MAKING IN SOLAR ENERGY PROJECT RISK ASSESSMENT
General situation of solar energy risk assessment
The use of photovoltaic (PV) solar systems for the generation of electric power has increased dramatically All over the world in recent years. The reason for this has been, on the one hand, the recent development of a favorable legal framework and, on the other, the undefeatable revenue that the PV systems allow in a long term period. The rapid development of the sector has favored the increase of industrial investments in PV technology and generation (Salas V, Olias E., 2009).
As the PV industry matures, successful risk management practices will become increasingly important to ensure investor confidence, control costs, and facilitate further growth. This study discusses several key aspects of risk management during the commercial- and utility-scale project life cycle, from identification of risks, to the process of mitigating and allocating those risks among project parties, to transferring those risks through insurance. The study also explores novel techniques in PV risk management, options to offload risks onto the capital markets, and innovative insurance policies (namely warranty policies) that address risks unique to the PV sector.
One of the major proofs for huge risk management in the PV industry is the cost-reduction opportunities it provides. PV projects are now subject to high economic costs, caused by one part to the market’s perception of the risks associated with: (1) investing in an industry that is still perceived to be in a relative stage of infancy; (2) arranging the complex financial structures often necessary to fund projects; and (3) the lingering uncertainty over PV asset performance over time, among other things. In the end, failure to develop projects at some point in the development process comes at considerable cost for the project developer as well as the solar industry as a whole.
The risks affecting solar projects appear throughout the entire project lifetime, but vary greatly in character. Here are some examples:
Construction risk: Risk of property damage or liability stemming from errors during the building of new projects.
Company risk: Risk affecting the viability of the project developer, for example, risks related to key personnel, financial solidity and technical ability to execute on plans.
Environmental risk: Risk of environmental damage caused by the solar park including any liability following such damage.
Financial risk: Risk of insufficient access to investment and operating capital.
Market risk: Risk of a cost increases for key input factors such as labor or modules, or rate decreases for electricity generated.
Operational risk: Risk of unscheduled plant closure due to the lack of resources, equipment damages or component failures.
Technology risk: Risk of components generating less electricity over time than expected.
Political and regulatory risk: Risk of a change in policy that may affect the profitability of the project, for example changes in levels of tax credit or RPS targets. Also, this includes changes in policy as related to permitting and interconnection.
Climate and weather risk: Risk of changes in electricity generation due to lack of sunshine or snow covering solar panels for long periods of time.
Sabotage, terrorism and theft risk: Risk that all or parts of the solar park will be subject to sabotage, terrorism or theft and thus generate less electricity than planned.
As the utility-scale solar power industry expands in the Middle East and North Africa, active risk management strategy and its implementation will be a key to continued success for financiers, developers and contractors. Utility-scale solar power projects are inherently risky, but their risk presents significant opportunities for parties to provide an economical and environmentally-beneficial power source for the region. Skilled and customized risk management on each project maximizes profit potential and longevity of the plants, making the most of the opportunity presented by current technology and site availability.
As a general matter, how would you assess the overall degree of risk associated with each of the following stages of building and operating a renewable energy power plant? For example, in north Africa ,where renewable energy risk is randomly distributed, (Nadejda Komendantova, Anthony Patt, Keith Williges,2011) showed that of the nine classes of risk, only three were rated as being of a high level of concern by at least one of the experts. These are regulatory risks (which include complexity and corruption of bureaucratic procedures and instability of national regulations), political risks (including low level of political stability in a country and the lack of support from local governments) and force majeure risks (which include natural and human-made disasters, including terrorism).
All other six classes such as technical, construction, operation, financial, revenue and environmental were evaluated as low or medium important. Both evaluations of seriousness of concern and likelihood to happen showed that the risk of inappropriate bureaucratic procedures and corruption was evaluated as very serious for North African region and most likely to happen under present conditions.

Figure 3.1: Risks perceived as being most serious by investors (n = 18). Source: (Komendantova N, Patt AG, Barras L, Battaglini, 2009)
Current approaches for decision making
Decisions may be made under social pressure or time constraints that interfere with a careful consideration of the options and consequences. Decisions may be influenced by one’s emotional state at the time a decision is made. Making decisions is certainly the most important task of a manager and it is often a very difficult one. This site offers a decision making procedure for solving complex problems step by step. Unlike the deterministic decision-making process, in the decision making process under uncertainty the variables are often more numerous and more difficult to measure and control. However, the steps are the same. They are:
Simplification
Building a decision model
Testing the model
Using the model to find the solution
It can be used again and again for like problems or can be modified.
In project risk management practices, decisions can be made according to the market selection, the project portfolio selection, or markup selection. In the solar energy industry, the risks are assessed with a standardized project risk management approach in order to identify evaluate and manage the risks in investment. To manage these risks, the right decision must be taken. In standard project risk assessment, quantitative and qualitative methods are used to lead the project manager to the right decision.
There are currently many ways for qualitative or quantitative decision making techniques in solar energy risk management, but just one of each will be presented in this section.
Influence Diagram methods
Influence diagrams (IDs) are graphical models for representing and solving complex decision-making problems based on uncertain information. Nowadays, they have become a popular and standard modeling tool. These diagrams are structured using three types of nodes: chance, decision and utility nodes.
•Chance nodes: These correspond to the variables of the problem, except for decision variables and the utility variables. Arcs toward chance nodes mean that the probability distribution of these variables is conditional on their parents.
•Decision nodes: These correspond to the decision variables of the problem at hand. Arcs from chance nodes toward decision nodes mean that the probability distribution of these chance variables will be affected by the decision. Arcs from decision nodes to chance nodes mean that the probabilities of these chance variables can be affected by the decision. If the influence diagram contains more than one decision node, these nodes should be ordered in a decision sequence.
•Utility nodes: These correspond to a table of utility values within the context of the parent nodes.
Rectangles represent decisions
Ovals represent chance events that impact the outcome of a decision
Diamonds represent the consequence or payoff node of a decision
Rounded rectangles represent constant inputs and interim calculations
Arrows represent relevance or sequence
Influence diagrams offer many advantages. The three primary advantages are ease of use, knowledge representation and modeling, and uncertainty management:
•Ease of use: The graphical representation of an influence diagram is clear and intuitive, which makes these diagrams easy to use and validate.
•Knowledge representation and modeling: Influence diagrams offer a simple meaningful way to model complex problems. They make it possible to consider different source and types of knowledge in a single model.
•Managing uncertainty: In real-life problems, criteria and factors are often uncertain and independent of each other because several elements can influence them.
For example, as a solar energy project, if an independent power producer in a deregulated market deciding whether to invest in a PV farm, the influence diagram of his decision would be:
RPS credits
Return
INVESTOR NOT
Revenues
Capital cost
Operational risks
Technical risks
Climate risks
Regulations
Project risks
RPS credits
Return
INVESTOR NOT
Revenues
Capital cost
Operational risks
Technical risks
Climate risks
Regulations
Project risks
Figure 3.2: Influence diagram, the decision of investing in a PV project
The consequence (or payoff) of the decision is the estimated return. Estimated return is based on capital cost, a constant input, as well as estimated revenues and operations and maintenance costs. Project risk is an interim point, which is also very important in the return of the investments. The project risk calculation depends on various types of single risks that actually depend on random variables.
Value risk analysis with a Monte Carlo simulation
In the previous section we described a qualitative approach to evaluate the risks which may lower the value of an investment in a solar energy project. An important drawback of this approach is the lack of probability of outcomes. To characterize the role of risks and provide information on probabilities on occurrence, Monte Carlo simulations have been introduced in cash flow analyses. Instead of building separate scenarios which describe different views on the future, Monte Carlo analyses build on distribution functions for each input variable which is subject to uncertainty. In a Monte Carlo analysis a large number of cash flow calculations are made. For each calculation, a new set of input data is drawn randomly from the distribution function for each input parameter.
Each calculation results in an outcome for the net present value of the project which can be used in the final analysis. By ranking all outcomes it then becomes possible to characterize the probability function of the net present value of the project under uncertain conditions. The expected net present value is then given by the median value of the distribution function:
Expected NPV = NPV (P = 50%)
It is important to note that the expected NPV defined in this way, may differ (strongly) from the average NPV in case of a skewed distribution function. Under these conditions, the median value represents a better estimate for the expected value than the average value.
The available distribution function for the NPV of the project also allows examining the certainty of the expected value. We can define an uncertainty range which tells between which values the expected value may vary at a certain probability level. Similarly, we can identify a measure of risk: risks correspond to the lower band of the uncertainty range, while opportunities correspond to the upper band of the uncertainty range.
In this way, we can calculate the value-at-risk (VaR) which can be defined by:
VaR = NPV (P=50%) – NPV (P=10%).
The value-at-risk, defined in this way, covers 80% of the investment risk and reflects a commonly used definition. This definition, however, leaves a possibility that the actual risk may be larger. For stricter measures, one may apply a different definition which includes the impact of events with a low probability.
Finally, the Monte Carlo approach allows an estimate of the probability, that the investment does not meet the requirements of the investor on financial returns. (The net present value is negative). This probability is given by:
P (loss) = S [P (NPV<0)]
Figure 3.3 shows the effect a risk premium has on the VaR. The risk premium on the energy price shifts the range of possible returns to the right. This leads to higher value for the average return or to a lower risk of negative returns, hence a lower Value-at-Risk. The conclusion is that the need for the project developer to cover up his risks leads to higher prices for the buyer of the electricity
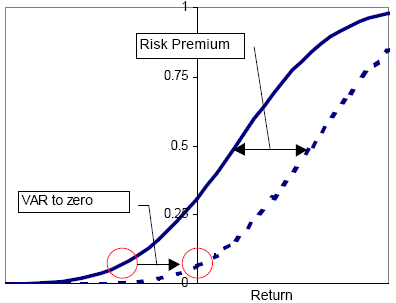
Figure 3.3: Risk premium for an investment project (VAR = 0).
The risk premium equals the increased return required for making the project risk free .In case the government subsidizes the production of renewable energy for reaching national goals, the risk premium will not be transferred to the end consumer, but will have to lead to a higher subsidy level. Long term feed-in contracts may reduce the project developer’s risk considerably, because the guarantee a constant cash-flow over a longer period, removing (partly) the risk premium and hence the subsidy level can be lower
Limitation analysis
Although these decision making methods are commonly used and important for classic risk assessment, it faces numerous problems facing uncertainty and less data.
Decision analysis in general assumes that the decision-maker faces a decision problem where he or she must choose at least and at most one option from a set of options. In some cases this limitation can be overcome by formulating the decision making under uncertainty.
In decision making under pure uncertainty, the decision-maker has no knowledge regarding which state of nature is « most likely » to happen. He or she is probabilistically ignorant concerning the state of nature therefore he or she cannot be optimistic or pessimistic. In such a case, the decision-maker invokes consideration of security.
Notice that any technique used in decision making under pure uncertainties, is appropriate only for the private life decisions. Moreover, the public person (i.e., you, the manager) has to have some knowledge of the state of nature in order to predict the probabilities of the various states of nature. Otherwise, the decision-maker is not capable of making a reasonable and defensible decision.
To overcome this uncertainties and complicated situations in qualitative or quantitative ways of taking a decision, we proposed an improved model of assessing risks and take the right decision for solar energy projects.