
This thesis develops a fuzzy logic–based decision-making model to improve project risk assessment, focusing on solar energy projects. By using MATLAB’s Fuzzy Logic Toolbox, the research proposes a computer-assisted tool for project managers to evaluate risks under uncertainty. The approach enhances early risk identification, prioritization, and decision-making, offering cost savings, improved accuracy, and practical application in large-scale solar energy projects.
Northwestern Polytechnical University
School of management
西北工业大学硕士学位论文
A thesis dissertation submitted in Partial fulfilment of the requirement for the degree of
Master of Project Management
At
School of management,
Northwestern polytechnical University
Title:

An Improvement of decision making for project risk assessment using the fuzzy logic concept
By
Bouba Oumarou Aboubakar
Supervisor:
Dr. Fang Wei
Xi’an, P.R.China
December, 2015
Abstract
Risk associates and project managers play an important role in ensuring that projects are completed by the scheduled date and within the given costs. A comprehensive review of risks is critical to properly manage a high risk project due to uncertainty flexibility. The aim of this work is to design an approach that utilizes a fuzzy decision making system for solar energy project risk assessment.
The algorithm developed in this thesis is based upon fuzzy logic, giving it the ability to solve unclear problems plagued with uncertainty and vagueness. A fuzzy decision making system is designed and implemented using the MATLAB Fuzzy Logic tool box for project risk analysis. The model developed is quite proactive to the major different of risks can be found in a solar energy project platform.
The project manager is offered with the model a computer based interface to help him dealing with the multiple fuzzy computations that are needed trough the assessment.
Keywords: Fuzzy logic, Decision making, Risk assessment, Computer based interface
INTRODUCTION
Motivation
Numerous solar energy projects have been created around the world to reduce the greenhouse gas emissions. Especially in Africa, where the population is set to double by 2050 and its energy needs will grow even faster. If current growth rates are maintained, Africa’s GDP will increase seven-fold by 2050. Providing full electricity access to all Africans will require at least a doubling of total electricity production by 2030 from current levels.
Then the need to replace fossil fuels has engendered a sense of urgency in seeking energy resolutions. The continent has about 36 macro-solar projects, and China by contrast lured $67.7 billion in investment and the U.S. $44.2 billion. (Anthony DiPaola, Bloomberg (http://www.renewableenergyworld.com/rea/u/bloombergnews-editors), 2013).
Project managers and associates are under pressure to generate results from these ongoing solar projects. As downstream investments in solar energy continue to grow, and as PV comprises a larger portion of the energy mix, it is becoming increasingly important for stakeholders across the industry to understand the particular risks associated with PV and the most effective means of managing them.
Project risk management (PRM) is a concept which is used in all industries especially in the solar energy sector. (Potts 2008) explains that its application is promoted in all projects in order to avoid negative consequences. Probability models are prevalent in risk quantification and assessment. However, a probability model built upon classic set theory may not be able to describe some risks in a meaningful and practical way. The newer models such as fuzzy logic and neural networks might do a better job in understanding and assessing certain risks, such as operational risk.
The use of fuzzy sets to describe the risk factors and fuzzy-based decision techniques to help incorporate inherent imprecision, uncertainties and subjectivity of available data, as well as to propagate these attributes throughout a model, yield more realistic results. Fuzzy logic modeling techniques can also be used in risk management systems to assess risk levels in cases where the experts do not have enough reliable data to apply statistical approaches.
Fuzzy-based techniques seem to be particularly suited to modeling data which are scarce and where the cause-effect knowledge is imprecise and observations and criteria can be expressed in linguistic terms (Kleiner, Y., at all 2009.).Therefore, it may be beneficial to build and implement more appropriate operational risk models for solar projects using a newer approach such as fuzzy logic.
Many previous studies (Klemetti, 2006; Lyons and Skitmore, 2002; Zou et al. 2006) have been conducted within the field of PRM but each presents a different approach. This research explores areas where fuzzy logic models may be applied to improve risk assessment and risk decision-making in solar projects. It discusses the methodology, framework and process of using fuzzy logic systems for computing solar energy project risks levels which ends to a right decision.
In this introduction, the focus is to identify both the need for and the aim of engaging in project risk management. After creating an insight in the research environment and motivation, the research objectives will be defined through problem statement and research questions and sub questions. With the motivation, objectives and methods in place, the research outlines and structure are provided to explain how this research was conducted.
Research Questions
Since the middle of the last century, many organizations are using project management approach to bring about the change needed to meet organizational goals and objectives. In Africa, where solar energy project is in total expansion, project managers will be asked to make a given number decisions, but how to make the decision facing uncertain data or conditions? This main question will lead us to these different interrogations.
How to use the fuzzy logic technique to model a new way of assessing risks in solar energy project management?
How to make sure that the created model is valid?
How to implement the validated model in a software tool?
Purpose of the study
The goal of this research is to design and implement and validate a new decision making model that can be used in solar energy projects risk assessment. This model, applying a fuzzy inference system, will be used to assist project managers in identifying potential risk factors and evaluating the corresponding impacts and take the right decision to overcome it.
With the model, a software tool will be offered; that tool will accomplish all the mathematical computations for the decision maker, and present the overall risk assessment in a more dynamic way. Such a tool will not only reduce the cost of assessment by hiring experts, but also save time as well.
Research Contributions
This research makes two main contributions:
First, it introduces a new model for solar energy risk assessment method based on a combination of fuzzy inference early project risk identification, risk prioritization, and the preparation for a risk control plan based on project risk level results.
Second, it creates a new software tool that will be to facilitate the task of solar energy project managers.
Thesis structure
The thesis is organized into seven chapters. Chapter 2 provides an overview of the literature that was reviewed, including both academic literature and examples of real-world applications of project risk approaches. This literature is divided into four categories: Project risk management framework (objectives, process, and activities), the importance of decision making in PRA, and Introduction to Fuzzy logic, and a Fuzzy logic based risk management (process, advantages, disadvantages).
Chapter 3 contains a presentation of current practices and approaches for solar energy project risk assessment, and the limitation of these practices
Chapter 4 provides an overview of the approach used to develop an improved risk assessment model based of the fuzzy logic mathematical tool, including the discussion of alternatives that were considered, and how this helped to derive the proposed approach.
Chapter 5 contains a discussion of implementation of the proposed risk assessment approach through a case study, including issues to consider in terms of both data and organizational requirements. It provides an overview and use of the software that was implemented for this project, as well as suggestions for organizational responsibilities.
Chapter 6 contains an interpretation of the results that were found during this research and approve the effectiveness of the new model.
Chapter 7 provides a conclusion and summarizes the key aspects of the proposed risk assessment process.
In the following figure, a more illustrative picture of the thesis structure can be found.
Introduction
Literature review
Current approaches for decision making in S.E.PRA.
An Improved model for project risk assessment
Implementation and case study
Conclusion
Validation and Discussion
Introduction
Literature review
Current approaches for decision making in S.E.PRA.
An Improved model for project risk assessment
Implementation and case study
Conclusion
Validation and Discussion
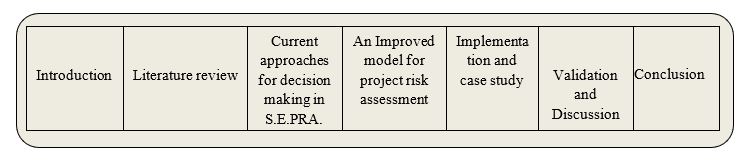
Figure 1.1: the outline of the thesis
LITTERATURE REVIEW
Project risk management framework
Risk definition and principles
Many explanations and definitions of risks and risk management have been recently developed, and thus it is difficult to choose one which is always true. Each author provides his own perception of what risk means and how to manage it. The description depends on the profession, project and type of business (Samson, 2009). Although risk has been defined in various ways, some common characteristics can be found (Chia, 2006):
A risk is a future event that may or may not occur.
A risk must also be an unknown event or condition that, if it occurs, has a result on, at least, one of the project objectives, such as scope, schedule, cost or quality.
The probability of the future event occurring must be greater than 0% but less than 100%. Future events that have a zero or 100% chance of occurrence are not risks.
The impact or consequence of the future event must be unexpected or unplanned for.
In many projects, particularly large ones, key performance issues are often less related to technology, but rather are related to uncertainty introduced by the existence of multiple parties and the associated project management infrastructure.
While employees and other agents of a project owner are essential to the achieving of project performance, they also contribute to uncertainty about future performance. This uncertainty arises from several factors associated with each project party, including (Ward SC, 1999):
- uncertainty about the level of performance that will be achieved;
- the objectives and motivation of each party;
- the quality and reliability of work undertaken;
- the extent to which each party’s objectives are aligned with the project owner’s objectives, and the scope for moral hazard where one party is motivated to do things which are not in the best interests of the project owner;
- the actual abilities of the party;
- Availability of the party.
In order to manage risks we have to understand what a risk is. The official definition provided to me by Professor James Garven, University of Texas at Austin is from the American Risk and Insurance Association: Risk management is the systematic process of managing an organization’s risk exposures to achieve its objectives in a manner consistent with public interest, human safety, environmental factors, and the law. It consists of the planning, organizing, leading, coordinating, and controlling activities undertaken with the intent of providing an efficient pre-loss plan that minimizes the adverse impact of risk on the organization’s resources, earnings, and cash flows.
There are two stages in the process of Project Risk Management, Risk Assessment and Risk Control. Risk Assessment can take place at any time during the project, though the sooner the better. However, Risk Control cannot be effective without a previous Risk Assessment.
Similarly, most people tend to think that having performed a Risk Assessment; they have done all that is needed. Far too many projects spend a great deal of effort on Risk Assessment and then ignore Risk control completely.
Concept of Project risk management
Risk management provides a clear and structured approach to identifying and managing the risks to which a project is exposed, which is based on the creation and implementation of an effective plan to either prevent losses or to reduce their impact if they should occur. Effective risk management practice does not eliminate risk. It merely reduces risk by providing project managers with a means by which they can measure and prioritize inherent project risks in order to make well informed decisions with respect to identifying appropriate actions.
Smith et al. (2006) provide a comprehensive description of the concept of RM and how it can be used in practice. According to the authors, risk management cannot be perceived as a tool to predict the future, since that is rather impossible. Instead, they describe it as a tool to facilitate the project in order to make better decisions based on the information from the investment. In this way, decisions based on insufficient information can be avoided, and this will lead to better overall performance. In the literature, RM is described as a process with some predefined procedures. The scope of its definition differs among the authors; however the core information is the same. From a number of definitions which can be found in the management literature Cooper et al. (2005) explanation brings the essence of this concept:
The risk management process involves the systematic application of management policies, processes and procedures to the tasks of establishing the context, identifying, analyzing, assessing, treating, monitoring and communicating risks (Cooper et al., 2005).
At the project management level, the risk management standard refers to the standard defined in the PMBOK® which defines risk as “an uncertain event or condition that, if it occurs, has [either a] positive or negative effect on the project objectives”. The Project Risk Management knowledge area is one of nine knowledge areas addressed in PMBOK® that describes the process of risk management planning, identification, analysis, response, monitoring, and control that acts as a guide for implementing project risk management.
On the subject of risk management process, there have recently been a large number of researchers which have proposed different processes. Some of the most important approaches are: PRAM (Chapman, 1997), RAMP (Institution of Civil Engineering, 2002), PMBOK (Project Management Institute, 2008), RMS (Institute of Risk Management, 2002).
Risk management process (RMP) is the basic principle of understanding and managing risks in a project. It consists of the main phases: identification, assessment and analysis, and response (Smith et al. 2006) as shown in Figure 2.1. Almost all of these approaches have a similar framework with differences in the established steps in order to get the risks control.
Effective risk management involves a four-phase process:
- 1. Risks identification: The process of determining which risks may affect the project and documenting their characteristics.
- 2. Risk assessment: The process of prioritizing risks for further analysis by assessing and combining, generally, their probability of occurrence and impact.
- 3. Risk response: The process of developing options and actions to enhance opportunities and to reduce threats to the project objectives.
- 4. Risk monitoring and reviewing: The process of implementing a risk response plan, tracking identified risks, monitoring residual risks, identifying new risks, and evaluating the risk process effectiveness throughout the project.
All steps in RMP should be included when dealing with risks, in order to efficiently implement the process in the project. There are many variations of RMP available in literature, but most commonly described frameworks consist of those mentioned steps. In some models there is one more step added, and the majority of sources identify it as risk monitoring or review.
Risk response
Risk review
Risk Analysis
Risk Identification
Risk control
Risk response
Risk review
Risk Analysis
Risk Identification
Risk control
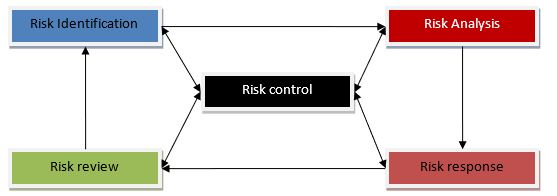
Figure 2.1: The process of managing risks (Smith et al. 2006)
Risk management benefits
To maximize the efficiency of risk management, the RMP should be continuously developed during the entire project. In this way, risks will be discovered and managed throughout all the phases (Smith et al. 2006). The benefits from RM are not only reserved for the project itself, but also for the actors involved. The main incentives are clear understanding and awareness of potential risks in the project. In other words, risk management contributes to a better view of possible consequences resulting from unmanaged risks and how to avoid them. (Thomas, 2009)
Another benefit of working with risk management is increased level of control over the whole project and more efficient problem solving processes which can be supported on a more genuine basis. It results from an analysis of project conditions already in the beginning of the project. (Perry, 1986) The risk management also provides a procedure which can reduce possible and sudden surprises (Cooper et al. 2005).
Different attitudes towards risk can be explained as cultural differences between organizations, where the approach depends on the company’s policy and their internal procedures (Webb, 2003). Within the RM, three company’s approaches can be distinguished.
The first one is the risk-natural firm which does not invest much in risk management but is still aware of the most important risks. The second approach is the risk-averse, where no investments are made in order to reduce the probability of occurrence of risk. The last one is the risk-seeker where the organization is prepared to face all risks and is often called gambler. In the long term, the risk-seeking companies can get a lower profitability compared to risk-natural firms. This is because of the large investments and losses when repeating the risk management processes over and over again to ensure all risks have been managed before the risks actually occurs (Winch, 2002).
Purpose of Project risk assessment
Risk analysis is the second stage in the RMP where collected data about the potential risk are analyzed. Risk analysis can be described as short listing risks with the highest impact on the project, out of all threats mentioned in the identification phase (Cooper et al. 2005). Although some researchers distinguish between terms risk assessment and risk analysis and describe them as two separate processes, for the purpose of this paper, this part of RMP will be consistent with the model provided by Smith et al. (2006) and described as one process.
In the analysis of the identified risk, two categories of methods – qualitative and quantitative – have been developed. The qualitative methods are most applicable when risks can be placed somewhere on a descriptive scale from high to low level. The quantitative methods are used to determine the probability and impact of the risks identified and is based on numeric estimations (Winch, 2002).
Companies tend to use a qualitative approach since it is more convenient to describe the risks than to quantify them (Lichtenstein, 1996). In addition, there is also one approach called semi-quantitative analysis, which combines numerical values from quantitative analysis and description of risk factors, the qualitative method (Cooper et al. 2005). However, this approach will not be further addressed in this paper.
Lichtenstein (1996) explains a number of factors that can influence the selection of the most appropriate methods in the risk assessment for the right purpose. It is up to each organization to decide which of these factors are the most critical for them and develop the assessment accordingly. In a survey conducted by Lichtenstein (1996), many factors were discovered, and the most important ones are listed below.
- Cost of using the method, both the employment cost and the method itself
- Adaptability, the need of adapting to the organization’s requirement
- Complexity, how limited and simple the method is
- Completeness, the method needs to be feasible
- Usability, the method should be understandable to use
- Validity, the results should be valid
- Credibility
Within the quantitative and qualitative categories, a number of methods which use different assumptions can be found, and it may be problematic to choose an appropriate risk assessment model for a specific project. The methods should be chosen depending on the type of risk, project scope as well as on the specific methods requirements and criteria.
Quantitative methods
Quantitative methods need a lot of work for the analysis to be performed. The effort should be weighed against the benefits and outcomes from the chosen method, for example smaller projects may sometimes require only identification and taking action on the identified risks, while larger projects require more in depth analysis. The quantitative methods estimate the impact of a risk in a project (PMI, 2009).
They are more suitable for medium and large projects due to the number of required resources such as complex software and skilled personnel (Heldman, 2005).
-
Scenario technique – Monte Carlo simulation
The Monte Carlo method is based on statistics which are used in a simulation to assess the risks. The simulation is used for forecasting, estimations and risk analysis by generating different scenarios (Mun, 2006). Information collected for the simulation is, for instance, historical data from previous projects.
The data represent variables of schedule and costs for each small activity in a project, and may contain pessimistic, most likely and optimistic scenarios (Heldman, 2005). The simulation can be presented as a basket with golf balls, as Mun (2006) explains the process. Data (the golf balls) are mixed and one of them is picked each time the simulation is done.
The chosen unit is an outcome which is recorded and the ball will be put back into the basket. The simulation is then redone a number of times and all outcomes are recorded. After completing the simulations required number of times, the average is drawn from all of the outcomes, which will constitute the forecast for the risk (Mun, 2006). The result from this method is a probability of a risk to occur, often expressed in a percentage (Darnall and Preston, 2010).
-
Diagramming technique
Decision tree analyses are commonly used when certain risks have an exceptionally high impact on the two main project objectives: time and cost (Heldman, 2005). There are two types of decisions trees; called Fault tree analysis (FTA) and Event tree analysis (ETA).
The FTA method of analysis is used to determine the probability of the risk and is used to identify risks that can contribute or cause a failure of one event (Cooper et al. 2005). The purpose is to find the underlying causes to this event. It is usually drawn up as a sketch of a tree. The branches are the causes to the problem, and the starting point of the tree is the problem itself. Each branch has its own sequence of events and possible outcomes. The problem could depend on some causes that are interrelated with each other, or simply random causes.
Fault tree analysis (FTA) and a similar analysis called event tree analysis (ETA), are simple methods which can be used as a structured model to identify causes and effects of a single event, but present different approaches (White, 1995).
As explained, ETA is very similar to the FTA, but what differentiates the methods is the outcome. ETA is also drawn as a tree but in an opposite approach than the FTA. According to White (1995), failure generally does not have its roots in a single cause. It is rather described as a chain of causes and consequences in a sequence which can end up in major damage for the project. The tree consists of branches which represent the consequences that can be followed by that main event that this method is analyzing. Every branch has its own focus on a specific type of causes, which is why the importance is so great to create a risk assessment. (White, 1995).
In both FTA and ETA, cause-effect skills are required including the possibility to understand how failure could occur and see which failure modes can arise from the situation respectively. Therefore it is preferable to have an analyst within the field of risk management in the project team (White, 1995).
Qualitative methods
Qualitative methods for risk assessment are based on descriptive scales, and are used for describing the likelihood and impact of a risk. These relatively simple techniques apply when quick assessment is required (Cooper et al. 2005) in small and medium size projects (Heldman, 2005). Moreover, this method is often used in case of inadequate, limited or unavailable numerical data as well as limited resources of time and money (Radu, 2009).
The main aim is to prioritize potential threats in order to identify those of greatest impact on the project (Cooper et al. 2005), and by focusing on those threats, improve the project’s overall performance (PMI, 2004). The complexity of scales (Cooper et al. 2005) and definitions (PMI, 2004) used in this examination reflect the project’s size and its objectives. During the phases of the PLC, risks may change, and thus continuous risk assessment helps to establish actual risk status (Cooper et al. 2005).
Limitations of qualitative methods lie in the accuracy of the data needed to provide credible analysis. In order for the risk analysis to be of use for the project team, the accuracy, quality, reliability, and integrity of the information as well as understanding the risk is essential. Qualitative methods are related to the quantitative methods, and in some cases constitute its foundations (PMI, 2004).
PMI (2004) identifies four qualitative methods for risk assessment: Risk probability and impact assessment, Probability/impact risk rating matrix, Risk Categorization and Risk Urgency Assessment. These methods are briefly discussed below.
-
Risk probability and impact assessment
By applying the method called risk probability and impact assessment, the likelihood of a specific risk to occur is evaluated. Furthermore, risk impact on projects objectives is assessed regarding its positive effects for opportunities, as well as negative effects which result from threats. For the purpose of this assessment, probability and impact should be defined and tailored to a particular project (PMI, 2004).
This means that clear definitions of scale should be drawn up and its scope depends on the project’s nature, criteria and objectives (Cooper et al. 2005). PMI (2004) identifies exemplary range of probability from ‘very unlikely’ to almost certain; however, corresponding numerical assessment is admissible. The impact scale varies from ‘very low’ to ‘very high’. Moreover, assessing impact of project factors like time, cost or quality requires further definitions of each degree in scale to be drawn up. Each risk listed under the identification phase is assessed in terms of the probability and the impact of its occurrence (PMI, 2004).
| Defined conditions for impact scales of a risk on major project objectives
(Examples are shown for negative impacts only) |
|||||
| Project objective | Relatives or numerical scale are show | ||||
| Very low /.05 | Low /10 | Moderate/.20 | High/.40 | Very high/.80 | |
| Cost | Insignificant cost increase | <10%cost increase | 10-20%cost increase | 20-40%cost increase | >40%cost increase |
| Time | Insignificant time increase | <5%time increase | 5-10%time increase | 10-206 time increase | >40% cost time increase |
| Scope | Scope decrease barely noticeable | Minor areas of scope affected | Major areas of scope affected | Scope reduction unacceptable to sponsor | Project item is affectively useless |
| Quality | Only degradation barely noticeable | Only very demanding application are affected | Quality reduction requires sponsor approval | Quality reduction inacceptable to sponsor | Project item is effectively useless |
| This table presents examples of risk impact definitions for the four different project objectives. They should be tailored in the risk management planning process to the individual project and to the organizations risk thresholds. Impact definitions can be developed for opportunities in a similar way. |
Table 2.1: rating impact for a risk source (PMI 2004)
Risk impact assessment investigates the potential effect on a project objective such as time, cost, scope, or quality. Risk probability assessment investigates the likelihood of each specific risk to occur. The level of probability for each risk and its impact on each objective is evaluated during an interview or meeting. Explanatory detail, including assumptions justifying the levels assigned, are also recorded.
Risk probabilities and impacts are rated according to the definitions given in the risk management plan. Sometimes, risks with obviously low ratings of probability and impact will not be rated, but will be included on a watch-list for future monitoring (Ritter, 2008).
-
Probability/impact risk rating matrix
Probability and impact, which were assessed in the previous step, are used as basis for quantitative analysis and risk response which will be explained further in the paper. For this reason findings from the assessment are prioritized by using various methods of calculation which can be found in the literature (PMI, 2004). Westland (2006) computes the priority score as the average of the probability and impact.
The range of priority score, the rating and color are assigned to indicate the importance of each risk (Westland, 2006). In order to set priorities, impact is multiplied by probability.
The compiled results are shown in the matrix (PMI, 2004). Such combination of factors indicates which risks are of low, moderate or high priority. Regardless of the calculation method chosen, such a combination of data shows priority of previously identified risks by use of i.e. corresponding colors or numerical system and helps to assign appropriate risk response. For instance, threats with high impact and likelihood are identified as high-risk and may require immediate response, while low priority score threats can be monitored with action being taken only if, or when, needed (PMI, 2004).
Risk score for a specific risk |
|||||
| Probability | Risk score =p x1 | ||||
| 0.9 | 0.05 | 0.09 | 0.18 | 0.36 | 0.72 |
| 0.7 | 0.04 | 0.07 | 0.14 | 0.28 | 0.56 |
| 0.5 | 0.03 | 0.05 | 0.10 | 0.20 | 0.40 |
| 0.3 | 0.02 | 0.03 | 0.06 | 0.12 | 0.24 |
| 0.1 | 0.01 | 0.01 | 0.02 | 0.04 | 0.08 |
| 0.5 | 0.010 | 0.20 | 0.40 | 0.80 | |
| Impact on an objective (e.g cost, time ,or scope)
(ratio scale) |
Table 2.2: Probability-Impact risk matrix (source PMBOOK)
-
Risk categorization, and Risk Urgency Assessment
Two methods mentioned by PMI (2004) are not as commonly used as probability and impact. Risk categorization is a way of systematizing project threats according to e.g. their sources, in order to identify areas of the project that are most exposed to those risks. Tools which can be used in this method are work break down structure (WBS) or risk breakdown structure (RBS), and their role is to develop effective risk response (PMI, 2004).
WBS breaks down large activities into small, manageable units and creates linked, hierarchical series of independent activities (Maylor, 2005). RBS categorizes risks and shows their dependencies (Dallas, 2006). The role of the second method, Risk Urgency Assessment, is to prioritize risks according to how quick response they require.
To solve the problem in risk evaluation method for project risk, this research proposes a fuzzy theory model for project risk assessment based on the project risk factor calculation. The model solves, to some extent, the problem of how to analyze and deal with the widely existing fuzzy in risk analysis, so as to provide a quantitative basis for correct risk assessment and to provide the decision makers with strong support and reference. The following part will be a collect of literature about fuzzy logic and fuzzy systems.