EFL students’ & students’ communication skills: the findings
Chapter III Presentation of the Findings
Introduction
This chapter presents the findings reached during conducting our investigation using two main tools: students’ questionnaire and teachers’ interview. The results are presented in the form of tables, diagrams and pie charts.
We have divided this part into two sections, the first deals with presenting the results of the students’ questionnaire and the second presents the findings of the teachers’ interview.
These two have been conducted with students and teachers of the Department of English at Mouloud Mammeri University of Tizi Ouzou.
3. 1. Presentation of the Results of the Students’ Questionnaire:
3. 1. 1. General Information about the Participants
Q1: What is your option?
| Options | Participants | Percentages |
| Language and Communication | 42 | 32. 31% |
| Didactics of Foreign Languages | 22 | 16. 92% |
| Literature and Civilisation | 23 | 17. 69% |
| Literature and Interdisciplinary Approaches | 19 | 14. 62% |
| Comparative Literature | 24 | 18. 46% |
| 130 | 100% |
Table1. Distribution of Master I Students
This table shows the different options from which we have selected our participants. The results show that the majority of them (32. 31%) study Language and Communication; (18. 46%) study comparative literature. (17. 69%) of the participants study Literature and Civilisation, (16. 92%) study Didactics of Foreign Languages and the remaining (14. 62%) study Literature and Interdisciplinary Approaches.
Q2. How long have you been studying English?
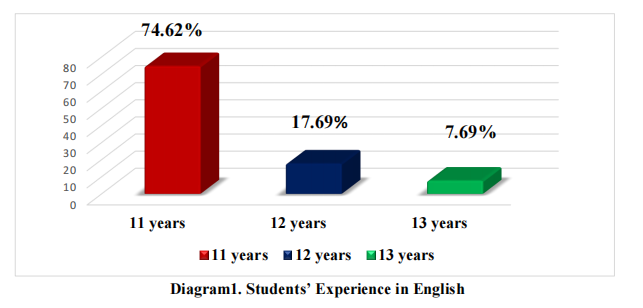
From the Pie chart above, the majority of the students (76. 62%) declared that they have been studying English for 11 years which is the ordinary number for a master one student. (17. 69%) declared that they have been studying English for 12 years, and (7. 69%) stated that they have been studying English for 13 years; consequently, they may have repeated one or two levels.
Q3. Have you ever been abroad for a linguistics seminar?
| Options | Participants | Percentages |
| Yes, I have | 110 | 84. 62% |
| No, I have not | 20 | 15. 38 % |
| Total | 130 | 100% |
Table2. Students’ Experience Abroad
The table above shows that (84. 62%) of the students have never been into other countries for a linguistic seminar; however, (15. 38%) of them have actually some experience abroad and say they have participated in linguistic seminars.
3. 1. 2. Students’ Attitudes towards the Use of Collaborative Visualization in English in the Department of English.
Q1: ‘‘Mutual activation (active collaboration among students) and share of knowledge is foundational for developing students’ communication skills’’.
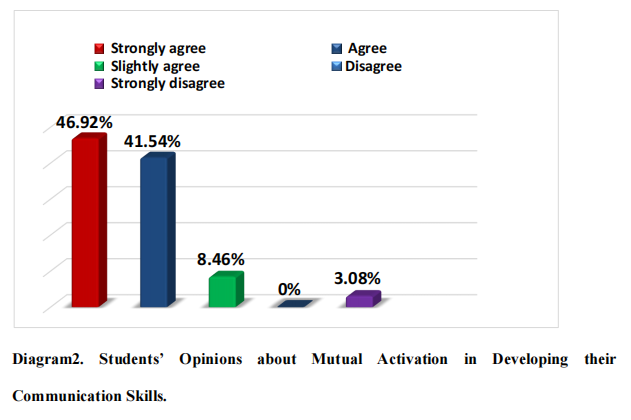
As the diagram shows, a great percentage of Master One students (46. 92%) strongly agree that mutual activation is foundational to promote students’ communication skills. (41. 54%) of them agree; whereas (8. 46%) slightly agree.
While no one disagrees; only (3. 08%) strongly disagree that the share of knowledge is fundamental in developing students’ communication skills.
Q2: ‘‘Grounding or creating a common frame of reference (particular set of beliefs or ideas on which you base your judgment of things)’’, to promote students’ communication skills, is:
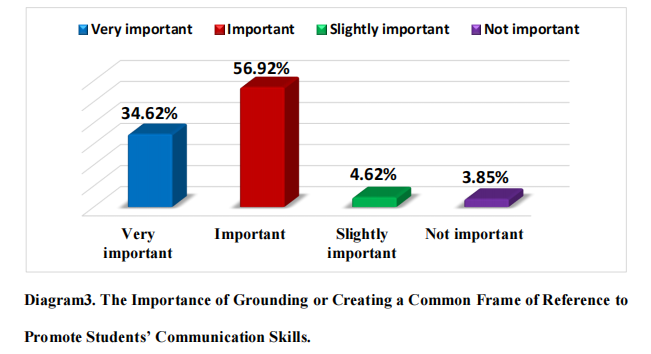
The results presented in this diagram display that the majority of the respondents (56. 92%) believe in the importance of grounding in developing students’ communication skills. (34. 62%) said that Grounding is not only important, but also very important.
While (4. 62%) believe that it is slightly important, only (3. 85%) think that grounding is not important.
Q3: Do you try to maintain the discussion during a collaborative activity?
| Options | Participants | Percentages |
| Yes | 123 | 95% |
| No | 7 | 5% |
| Total | 130 | 100% |
Table 3. Students’ Discussion Maintenance in Classroom.
The table displays that almost all the participants (94. 62%) do try to maintain the discussion during a collaborative activity; they answered by ‘Yes’; whereas, (5. 38%) have answered by ‘No’, which means they do not try to maintain the discussion.
Justification
| Items | participants | Percentageofthe participants% |
| a. Asking questions | 77 | 59. 23% |
| b. Suggesting ideas | 63 | 48. 46% |
| c. Giving one’s opinion | 71 | 54. 62% |
| d. Repairing focus divergence | 9 | 6. 92% |
| e. Clarifying and summarizing what has been said | 22 | 16. 92% |
| f. Providing feedback | 18 | 13. 85% |
Table4. Students’ Techniques for Maintaining Discussion
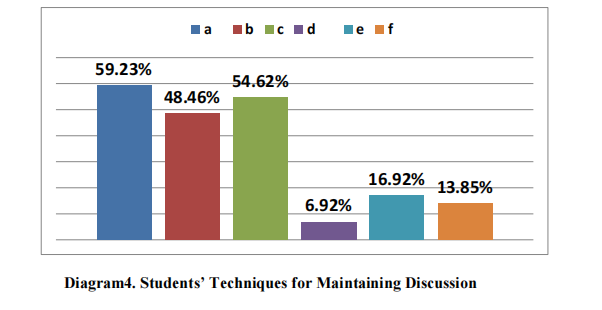
N. B. Sometimes the number of students exceeds 130 because they have provided multiple answers in multiple choice questions.
The total of percentages exceeds 100% because each item is counted independently.
According to Table 4 and diagram 4, it is noticed that 77 students which is the equivalent of (59. 23%) maintain the discussion during collaborative activities by asking questions; (54. 62%) which means 71 students prefer to give their opinions, and only 63 students (48. 46%) refer to suggesting their ideas.
Others, which represent (16. 92%), state that they maintain the discussion by clarifying and summarising what has been said; however, (13. 85%) make the discussion continue by providing their feedbacks. Lastly, (6. 92%) which means only 9 students repair focus divergence to continue the discussion.
Q4: Do you check the understanding of information being communicated to you?
| Items | participants | Percentage of the responses% |
| Asking verification questions | 85 | 65. 38% |
| Indicating agreement / disagreement | 35 | 26. 92% |
| Negotiating meaning | 49 | 37. 69% |
Table5. Students’ Techniques for Checking their Understanding
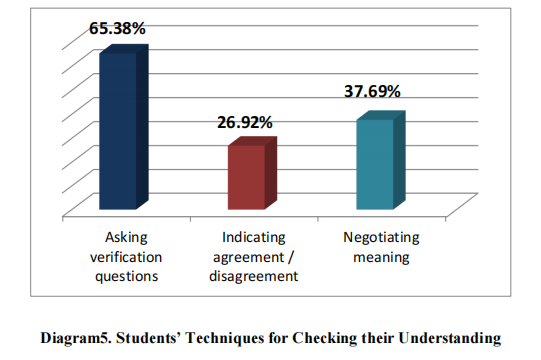
In this Table 5 and Diagram 5, we notice that half of our population (65. 38%) asks their teachers to check whether they understood well the information; (26. 92%) of them do indicate agreement or disagreement and (37. 69%) of them choose to negotiate meaning.
Q5: Do you think that negotiation during collaborative activities is important for developing your communication skills?
| Options | Participants | Percentages |
| Yes | 130 | 100% |
| No | 0 | 0% |
| Total | 130 | 100% |
Table6. The Significance of Negotiation during Collaborative Activities
As presented in this table, all the participants believe that negotiation during collaborative activities is important to enhance students’ communication skills and no one disagrees with that.
Justification
The students have explained that negotiation gives the learners the chance to talk. According to them, it is by communicating that students can express their opinions and share their ideas with the others.
Through negotiation, they believe they are able to express their ideas among group members freely. One of the students has said: “It allows [making] efforts to speak and express one’s opinions with the target language. Mistakes might be corrected by the teacher or classmates.
Indeed, we learn better from our mistakes and this is helpful to get rid of shyness”. Other learners answer: “It helps the students to get involved in the communication process which helps them to develop their speaking skill as well as their cognitive abilities and critical thinking”.
According to some others, negotiation allows students to debate about new themes by putting background knowledge into practice; furthermore, it “helps the students to improve their learning capacities in oral [speaking]”.
Finally, a student has said: “when you negotiate, you push yourself to use an appropriate vocabulary related to a given topic and it makes you develop your [critical] thinking and become more fluent [in speaking]”.
Q6: Do you learn better when collaborating or when learning individually? Why?
| Item | Participants | Percentages |
| Collaboratively | 113 | 87% |
| Individually | 17 | 13% |
| Total | 130 | 100% |
Table7. Students’ Preferences in Learning
In this table, it is shown that the majority of Master One students (87%) do prefer to learn collaboratively; whereas, (13%) of them do prefer to learn individually.
Justification
| Items | Participants | Percentages % |
| a. Collaborative learning enhances involvement in the classroom | 72 | 55. 38% |
| b. Collaborative learning improves confidence through interaction | 64 | 49. 23% |
| c. I feel uncomfortable and distracted when practicing a collaborative activity | 24 | 18. 46% |
| d. I do not have the opportunity to voice my ideas and opinions freely within a group | 14 | 10. 77% |
Table8. Students’ Reasons of their Learning Preferences
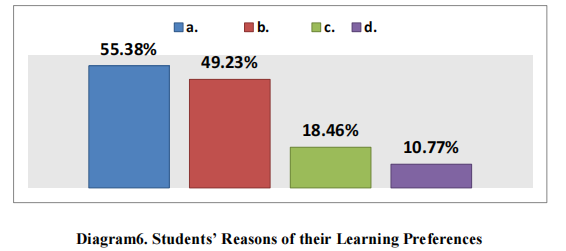
Diagram6. Students’ Reasons of their Learning Preferences
According to the data displayed in table 8 and Diagram 6, among the students who prefer to learn collaboratively, (55. 38%) which represent 72 students argue that collaborative learning enhances involvement in the classroom; whereas, 64 students which is the equivalent of (49. 23%), believe that collaborative learning improves confidence through interaction.
Conversely, among the students who prefer to learn individually, 24 students or (18. 46%) justify their choice by feeling uncomfortable and distracted when practicing a collaborative activity; while (10. 77%) or 14 students pretend not having the opportunity to voice their ideas and opinions freely within a group.
3. 1. 3. Students’ Attitudes towards Developing Communication Skills through Collaborative Visualization
Q1: How can collaborative visualization help the students develop their communication skills?
| Suggestions | Responses | Percentageofthe Responses% |
| a. It promotes the exchange of information | 70 | 53. 85% |
| b. It encourages you to participate more | 64 | 49. 23% |
| c. It allows you to learn more | 53 | 40. 77% |
| d. It develops your critical thinking | 37 | 28. 46% |
| e. Itfacilitatestheunderstandingof presented information | 34 | 26. 15% |
| f. It supports the remembering of the presented contents | 24 | 18. 46% |
Table9. Collaborative Visualization and Promoting Communication Skills
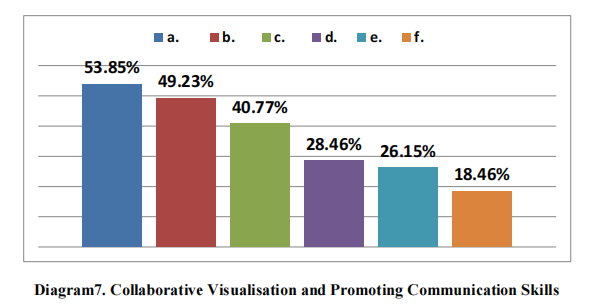
Table 9 and Diagram 7 demonstrate how collaborative visualization helps the students to develop their communication skills.
On the one hand, the majority of Master One students (53. 85%) believe that collaborative visualization promotes the exchange of information; (49. 23%) think that it encourages the students to participate more; whereas, (40. 77%) foresee that it allows them to learn more.
On the other hand, (28. 46%) say that it develops their critical thinking; (26. 15%) state that it facilitates the understanding of presented information, and for the remaining (18. 46%), collaborative visualization supports the remembering of the presented contents.
Q2: ‘‘ The combination of Collaborative Learning and Visualization gives better results in learning in general and in developing communication skills in particular’’
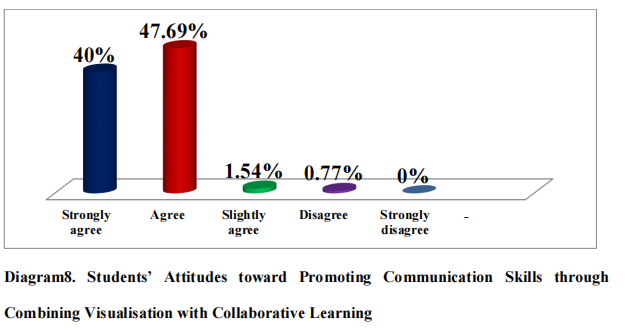
As this graph indicates, (47. 69%) agree with the fact that combining collaborative learning with visualization gives better results in learning and in promoting communication skills; (40%) of them strongly agree and only (1. 54%) of the respondents slightly agree with this fact. No one strongly disagrees and (0. 77%) of them disagree with that.
Justification
| Items | Participants | Percentages % |
| a. It is not sufficient to communicate effectively and clearly | 8 | 6. 15% |
| b. It is time consuming | 8 | 6. 15% |
| c. It is difficult and requires a lot of efforts | 3 | 2. 31% |
| d. It makes communication flexible | 45 | 34. 62% |
| e. It is enjoyable | 57 | 43. 85% |
| f. It increases credibility of the communicated message or information | 37 | 28. 46% |
Table10. Promoting communication skills through Collaborative Learning with Visualization
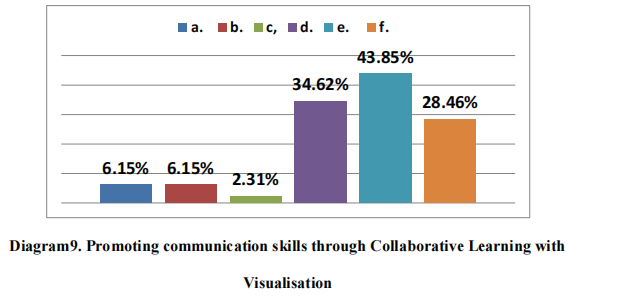
According to table 10 and Diagram 9, the majority of the students have a positive opinion about the combination of visualization and collaborative learning.
Most of them, 57 students or (43. 85%) agree that learning becomes enjoyable when the two are combined; (34. 62%) argue that it makes communication flexible. A few of Master One students (28. 46%) believe that it increases credibility of the communicated message or information. Contrary to the majority, the minority of the students have a negative point of view about the combination.
An equal number of students which is 8 or (6. 15%) believe that it is time consuming; therefore, it is not sufficient to communicate effectively and clearly. The remaining, which represents (2. 31%), thinks that it is difficult and requires a lot of efforts.
Q3: Do you agree that making use of collaborative visualization may lead to debates?
| Items | Participants | Percentages % |
| Yes | 125 | 96. 15 |
| No | 5 | 3. 85% |
| Total | 130 | 100% |
Table11. Debating through collaborative visualization
It is displayed in this table that almost all the students (96. 15%) agree that collaborative visualization may lead to debates and only (3. 85%) who disagree with that.
Q4: To what extent would the use of collaborative visualization improve your communication skills?
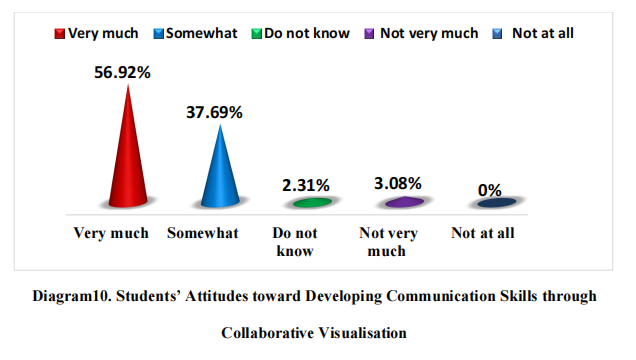
The results have revealed that the majority of students (56. 92%) approve that collaborative visualization can improve their communication skills very much; (37. 69%) of them have claimed that it can somewhat promote their communication skills while (3. 08%) have said that collaborative visualization is effective in developing communication skills, but not very much. (2. 31%) of them do not know and no one thinks that collaborative visualization would not enhance their communication skills at all.
Q5: How can collaborative visualization, both synchronous and asynchronous, help in developing communication skills?
| Items | participants | Percentages % |
| a. Itenablesstudentstoseedata, communicate and debate in context | 88 | 67. 69% |
| b. It provides immediate feedback | 62 | 47. 69% |
| c. Better real time response | 22 | 16. 92% |
| d. It motivates to rapidly think and answer | 49 | 37. 69% |
| e. It provides the ability to communicate with a remote team with members of multiple zones | 38 | 29. 23% |
| f. Having a record of the communication shared that can be referred to later on | 14 | 10. 77% |
| g. The chance to think before responding | 49 | 37. 69% |
Table12. Effectiveness of Synchronous and Asynchronous Collaborating in Promoting Students’ Communication Skills
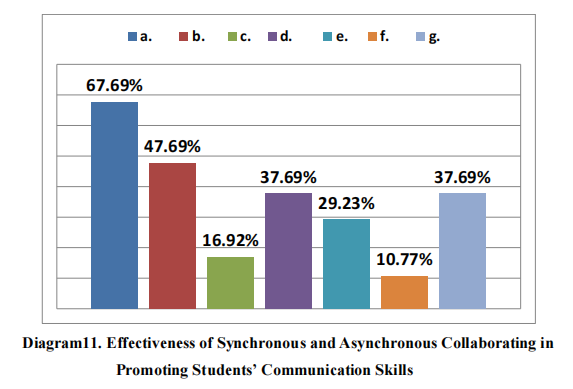
Table 12 and Diagram 10 reveal how collaborative visualization, both synchronous and asynchronous, can help in developing communication skills. It demonstrates that 88 out of 130 students think that collaborative visualization enables students to see data, communicate and debate in context.
Then, 62 of them say it provides immediate feedback. After that, the answers have been split equally which means 49 students. On the one hand, it motivates to rapidly think and answer; on the other hand, it gives the chance to think before responding. 38
Master One students state that collaborative visualization provides the ability to communicate with a remote team with members of multiple zones when it is asynchronous; however, 22 think that it gives a better real time response.
Finally, only 14 students believe that asynchronous collaborative visualization allows the students to have a record of the communication shared that can be referred to later on.
3. 2. Presentation of the Results of Teachers’ Interview
3. 2. 1. General Questions
Question 1: How long have you been teaching English?
This question is asked to determine the teachers’ experience with teaching English. The results show that the majority of respondents (05 teachers) have taught English for more than 10 years. However, there is only one teacher who has less than 10 years of experience.
Question2: Have you ever been abroad for a training period?
This question is to know about teachers’ experience abroad in the English speaking context, the results show that most of them (04 teachers) have been for a training period abroad while two of them have been in training periods here in Algeria.
3. 2. 2. Teachers’ Attitudes towards Collaborative Learning
Question3: Do you agree that ‘‘Mutual activation (active collaboration among students) and share of knowledge is foundational for developing students’ communication skills’’. Please, would you explain?
This question aims at showing the extent to which teachers agree with the fact that mutual activation is important for developing communication skills and explaining the way and the reason why it is so.
All of the respondents agree with this and they have explained it in different ways. Two of them have argued that students learn better from their mates and feel at ease while working together.
One of them has claimed that this mutual activation should be in all classes; through it, students who know more help students who know less. The fourth respondent thinks that it is important but not foundational.
He affirms that it is important to share knowledge and develop it; and that oral expression, which is essential in communication, is situational which means that students should have shared knowledge of vocabulary of each situation to better communicate.
The sixth teacher determines that mutual activation and shared knowledge are basic element of communication; it helps to foster dialogues and promotes interaction.
Question4: Do you think that ‘‘Grounding (knowledge of the basics of something) or creating a common frame of reference (particular set of beliefs or ideas on which you base your judgment of things)’’ is important to promote students’ communication skills?
This question is intended to show what teachers think of grounding. All the respondents share the idea that grounding is vital and that it makes communication better and the majority of them (05 teachers) have claimed that without grounding, students will not collaborate and communication will be difficult.
One of the teachers argues that a common frame of reference helps students to answer questions, solve problems, learn new things and understand better; and that its absence leads to a high risk of having some learners at the back because they do not follow the course of the discussion.
Question5: Do your students try to maintain the discussion during a collaborative activity?
This question aims at discovering whether students maintain the discussion in class and the ways they use to do it.
All the interviewed teachers have said that their students do try to maintain the discussion during a collaborative activity and the majority of them have claimed that their students ask questions to start a discussion while two of them have said that their students use all the suggested techniques depending on the module and the context, which means through asking questions, suggesting ideas, giving one’s opinion, clarifying and summarising what has been said and through providing feedback.
Question6: Do you check your students’ understanding of what has been communicated in the classroom? How?
The purpose of this question is to know if teachers check their students’ understanding and the techniques they do follow for this. All of them share the technique of asking verification questions and say that they, sometimes, do refer to the two other suggested techniques namely; indicating agreement / disagreement and negotiating meaning at the end.
Question7: Do you think that negotiation among students during collaborative activities is important for developing their communication skills? If yes, how?
The results of this question indicate what teachers do think of negotiation in terms of developing communication skills. All of them agree that negotiation is important.
They have all argued that it permits to students to express themselves and to put their knowledge into practice; they have added that when there is no negotiation, there is no collaboration and there is no communication.
3. 2. 3. Teachers’ Attitudes towards Developing Communication Skills through Collaborative Visualization.
Question8: Do you think that collaborative visualization should replace the traditional way of teaching?
The aim of this question is to know whether it is possible for collaborative visualization to replace the traditional way of teaching. All the respondents share the idea that collaborative visualization, rather than replacing the traditional way of teaching, should complement it.
Question9: Do you agree that collaborative visualization is:
- A good strategy of teaching.
- It needs to be encouraged.
- It makes the lesson more enjoyable.
- It should be used in all modules.
This question aims at knowing what teachers think of collaborative visualization. The majority of the respondents (05 teachers) have shared the first two choices, which means that collaborative visualization is a good strategy of teaching and it should be encouraged while one of them is for all the four suggestions.
Question10: Do you think that using collaborative visualization would improve students’ communication skills?
The purpose of this question is to find out what teachers think of collaborative visualization as a technique to promote students’ communication skills.
Four teachers out of six have said that it is an important technique that can help students to better communicate. Two of them have added that it depends on the topic and the situation and that, it is not sufficient alone, it should be reinforced and well planned in advance in order to get fruitful results.
Question11: Do you agree that making use of collaborative visualization may lead to debates?
This question permits to know whether teachers think that collaborative visualization may lead to debates and all of them agree that it does, because students when they see something together they are most of the time motivated to comment it and ask questions about it.
Question12: What are the difficulties that you may encounter with the implementation of collaborative visualization?
This question is meant to determine the difficulties that teachers may face if they implement collaborative visualization. All the teachers who have been interviewed have agreed on the lack of materials.
Conclusion
This chapter has presented the results obtained from students’ questionnaire, and teachers’ interview. We collected their attitudes and perceptions toward using collaborative visualization to promote students’ communication skills.
We have presented the data collected from the students’ questionnaire in form of tables, diagrams and pie charts and those from the teachers’ interview in form of well-structured paragraphs. The discussion of the data will be in the next chapter, as well as the conclusions of this research.